VWAP/TWAP User Guide
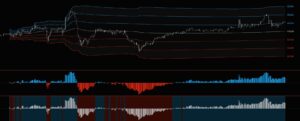
Volume Weighted Average Price (VWAP) calculates the average price of a security over a specific period, factoring in both price and traded volume. This powerful metric is widely used by traders to assess market trends, identify potential entry and exit points, and gauge the overall market sentiment by emphasizing volume as a critical component of price action.
Time Weighted Average Price (TWAP) determines the average price of a security over a defined period, focusing solely on time without accounting for traded volume. This approach is ideal for traders seeking a straightforward benchmark to evaluate price movements evenly across time intervals, making it useful for algorithmic trading or assessing consistent price trends.
VWAP/TWAP Indicator Highlights:
This indicator is included in our Orderflow Package and is also available as a standalone product.
- Multiple methods of calculating VWAP/TWAP are available:
- Regular VWAP:
- Offers many pre-configured reset intervals such as: Swing, RTH or ETH session, Week, Month, Quarter, Year
- Up to 5 customizable Standard Deviation bands
- VWAP Oscillator:
- Offers many pre-configured reset intervals such as: Swing, RTH or ETH session, Week, Month, Quarter, Year
- Difference can be calculated in Points or Percentage
- Anchored VWAP:
- Up to 5 different anchors per indicator instance
- Rolling VWAP:
- Rolling periods in any multiple of days, weeks and months
- Up to 5 customizable Standard Deviation band
- Single Anchored VWAP with up to 5 customizable Standard Deviation bands
- Single Anchored TWAP with up to 5 customizable Standard Deviation bands
- Multiple ways of highlighting when price is above or below VWAP by:
- Changing plot color
- Changing price bar color
- Highlighting chart background
- Automatic Accuracy vs. Performance Optimization delivers highly accurate intraday calculations while boosting speed for higher timeframes (Week, Month, Quarter, Year).
- Enhanced Plots menus allow customization of every aspect of plots including plot names and ability to conveniently turn plots on/off individually
- Does not require NinjaTrader’s Lifetime license
- Does not require Tick Replay
Adding and Removing Indicators
To add or remove indicators on your charts, consult NinjaTrader’s ‘Working with Indicators’ documentation for step-by-step guidance.
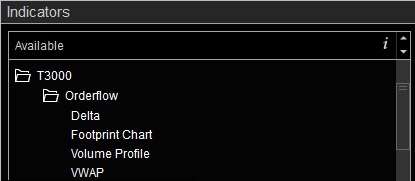
After installing the Orderflow package, you will find this indicator in the T3000/Orderflow folder within NinjaTrader’s Indicators menu.
User Guide
The following list of options and menus are available in this indicator and will be discussed in detail in the following sections.
Settings:
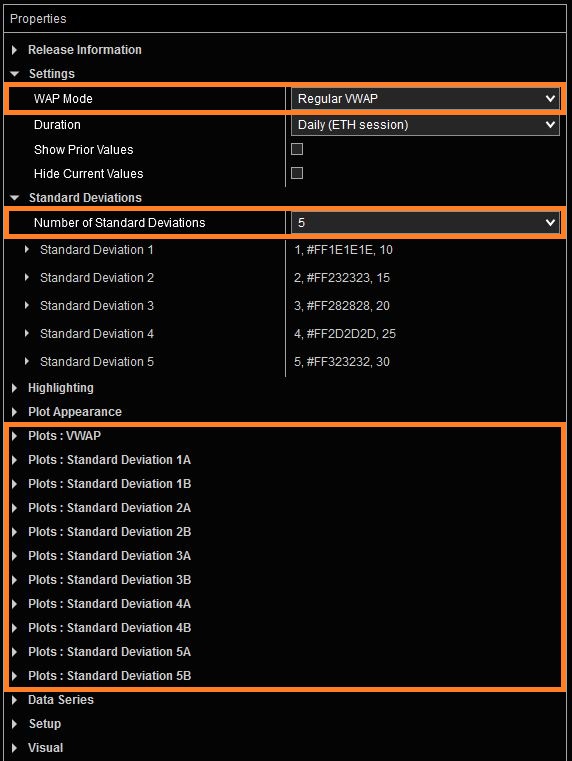
The Settings menu is context sensitive. The selected value for WAP Mode will determine what other settings are present on this menu or in other sections of Indicator Properties menu. One or more of the following settings may be present in this menu depending on selected options.
WAP Mode: This setting selects which of the following Weighted Averages are shown.
- Regular VWAP: Shows the standard VWAP plot. Various pre-configured reset intervals are available in this mode. Please see the Duration setting below for a complete list of available reset intervals. Regular VWAP offers up to five customizable Standard Deviation bands for all Durations except Swing.
- VWAP Oscillator: Shows the difference between price and VWAP in the form of an oscillator. Various pre-configured reset intervals are available in this mode. Please see the section Duration below for a complete list of available reset intervals.
Note: A new panel must be selected to display VWAP Oscillator.
- Anchored VWAP (Multiple): Anchored VWAP is a modified version of the standard VWAP that starts calculations from any marked point on the chart (i.e.; anchor). Up to five AVWAP plots can be displayed, each calculated from a different anchor point. The indicator will search for all user-drawn markers of the selected type on the chart and use the nearest price bar as VWAP anchor point. Up to five different anchor points can be marked on any chart. If more than five markers are detected, the five most recent ones will be used and those further back will be ignored. Markers may be placed above or below price bars. Please refer to the section Updating Anchors to learn how to work with anchors.
- Rolling VWAP: The Rolling VWAP is a modified version of the standard VWAP that calculates VWAP based on a moving window composed of smaller time segments. This window resets at the beginning of a new time segment. An example would be a 3-day Rolling VWAP that is based on the last three days of market data. As each session closes and a new session starts, the oldest session is dropped from calculations and the new session is added. Rolling VWAP offers up to five customizable Standard Deviation bands.
- Anchored VWAP with StdDev: Anchored VWAP is a modified version of the standard VWAP that starts calculations from any marked point on the chart (i.e.; anchor). In this mode only one VWAP plot is available along with up to five Standard Deviations. The indicator will search for a user-drawn marker of the selected type on the chart and use the nearest price bar as VWAP anchor point. If more than one marker is placed, only the most recent one will be used and those further back will be ignored. The marker may be placed above or below price bars. Please refer to the section Updating Anchors to learn how to work with anchors.
- Anchored TWAP with StdDev: This is similar to Anchored VWAP with StdDev, but uses the TWAP algorithm. Please refer to the section Updating Anchors to learn how to work with anchors.
Duration: This setting determines how frequently VWAP calculations are reset. This setting is only available with Regular VWAP and VWAP Oscillator. The following options are available:
- Swing: Shows VWAP values anchored to each swing leg (as determined using ZigZag). As new swing legs are detected, VWAP values are reset and recalculated for the new leg. The following option is available in this mode:
Rotation Size (Points): Defines the Deviation Value for the ZigZag routine which determines how swings are calculated and when they reverse. This value is in the units of points for the selected instrument.
- Please review Understanding ZigZag below for a better understanding of how ZigZag operates as it relates to swing-based VWAP.
- Daily (RTH Session): In this mode, VWAP calculations will stop at the end of the Regular Trading Hours (RTH) session and resume at the start of the next RTH session. The following option is available:
- RTH Session Template: This setting selects the Regular Trading Hours session template which determines RTH session start and end times. Detailed instructions on how to use this input are available here.
- Daily (ETH Session): In this mode, VWAP calculations will reset at the start of a new Extended Trading Hours (ETH) session.
- Weekly, Monthly, Quarterly, Yearly: VWAP calculations will reset at the start of the corresponding interval. Starting time for each interval is the opening time of the Globex session for the first day of the current interval.
Note: Weekly, Monthly, Quarterly and Yearly VWAP are only supported on time-based charts (i.e.; Data Series type must be one of Minute or Day) and are calculated in OnBarClosed mode only. Enough days must be loaded in Data Series properties to accommodate the selected duration, otherwise an error message will be displayed.
Show Prior Values: Setting this option will plot the closing values for VWAP from the previous interval as determined by the Duration setting. This option is available with Regular VWAP with the exception of swing-based VWAP. view image
Hide Current Values: Setting this option will hide current developing VWAP values. In conjunction with Show Prior Values, this combination can be used to only show prior period’s closing VWAP values as levels. This option is available with Regular VWAP with the exception of swing-based VWAP. view image
Oscillator Value Type: This setting is only available with VWAP Oscillator and selects one of two modes to calculate the Oscillator value.
- Points: Oscillator value is calculated as the difference between VWAP and price.
- Percentage: Difference between VWAP and price is expressed as percentage of current price.
Oscillator Zero Line: This setting is only available with VWAP Oscillator and customizes the appearance of the Zero Line on the Oscillator panel.
Rolling VWAP Period Type and Rolling VWAP Period Value: These settings determine the time frame for Rolling VWAP calculations. The Period Type specifies the duration of each base time segment, while the Period Value indicates how many of these segments are included. Note: For a daily-based Rolling VWAP, the Period Value counts active trading days, not calendar days.
Anchor Marker: This setting selects the Chart Marker type that is used to select the VWAP/TWAP anchor point. The drop-down menu includes the NinjaTrader keyboard shortcuts for each marker. This setting is available with any of the Anchored averages. Please refer to the section Updating Anchors to learn how to work with anchors.
Match Anchor Marker Color to Plots: When this option is selected, each added chart marker will be automatically colored the same color as the corresponding AVWAP/ATWAP plot. Otherwise, markers will retain their default color when they are placed on the chart. This setting is available with any of the Anchored averages.
Hide Anchor Placement Instructions: If there are no marked anchors detected on the chart, by default, the Anchored VWAP/TWAP will display instructions on how to mark anchors on the chart. If you don’t wish to see these instructions, check this box. If any markers are placed on the chart, the instructions will disappear automatically regardless of the state of this setting. This option is available with any of the Anchored averages.
Updating Anchors: Adding, Moving and Removing Anchors
Anchored VWAP/TWAP will search for user-drawn marker(s) on the chart to use as anchors for Anchored VWAP/TWAP calculations. The indicator will only search for the marker type that is defined in the Anchor Marker setting.
To place markers on the chart, you can either use the NinjaTrader keyboard shortcuts for the marker type you selected or go to the Drawing Tools menu from the chart window.
Markers may be moved/dragged on the chart to change the AVWAP/ATWAP anchor point. Markers may also be removed to remove the corresponding AVWAP/AVWAP plot. As anchors are added, removed and moved, the Anchored VWAP/TWAP will update in real time to reflect the current location of the anchor(s).
Note: Anchored VWAP/TWAP will continue to use resources for as long as it is loaded on the chart even if there are no markers and no AVWAP/ATWAP plots present on the chart. If you no longer wish to use the Anchored VWAP/TWAP, please remove it from the list of configured indicators to free up resources.
Standard Deviations:
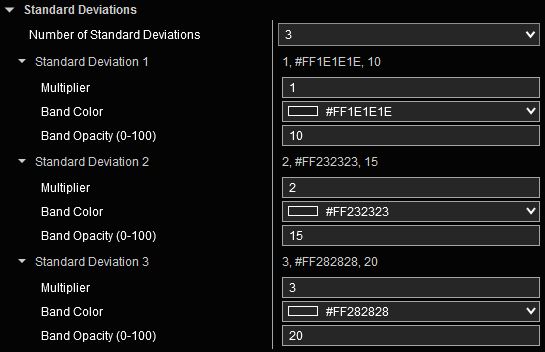
The Standard Deviations menu is context sensitive and is available in Regular VWAP (except Swing VWAP), Rolling VWAP and Anchored VWAP/TWAP with StdDev modes.
Up to 5 Standard Deviation plots can be displayed. Standard Deviation Multiplier values can be adjusted as needed. Band Color and Opacity settings can be used to customize the appearance of bands between Standard Deviation levels.
Standard Deviation plot appearance can be customized in the Plots section.
Highlighting:
This menu is available in Regular VWAP, VWAP Oscillator, Rolling VWAP and Anchored VWAP/TWAP with StdDdev modes. It will highlight various chart elements with different colors based on price being above/below the Weighted Average.
Available options are as follows. This image visually illustrates the various Highlight options.
- None: No highlight.
- Plot: The VWAP/TWAP plot is highlighted with selected colors based on price being above or below VWAP/TWAP.
- Price Bars: Price bars are highlighted with selected colors based on price being above or below VWAP/TWAP.
- Background: Chart background is highlighted with selected colors based on price being above or below VWAP/TWAP. In this mode, Background Opacity can be updated to adjust the transparency level of the highlight. Additionally, you may select to Highlight All Panels (if multiple panels are available on the chart), or only the primary panel.
Plot Appearance:
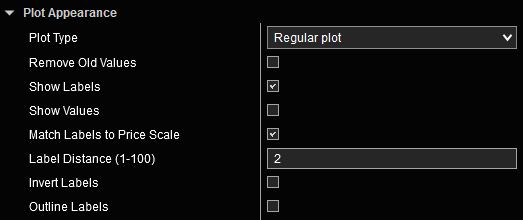
The Plot Appearance menu is a standard feature in all our indicators that include plots. Detailed explanation of various features and capabilities are available here.
Plots:
All of our indicators utilize Enhanced Plots Menus that augment the existing functionality provided by standard NinjaTrader Plots menus. The list of Plots that can be customized is context sensitive. Only those Plots that correspond to selected options are shown to reduce the number of inputs, and to streamline the Indicator Properties menu to only include those inputs that are relevant to the selected options. Please refer to Enhanced Plots Menu documentation for additional details.
Computation Accuracy and Supported Bar Types:
VWAP values for shorter timeframes are internally calculated using Tick granularity. This is the most accurate method for calculating VWAP and is used for shorter timeframes to offer the highest accuracy. All intraday chart types are supported. The Calculate mode in Indicator Properties may be set to OnEachTick or OnBarClose. This method is in effect in the following modes and timeframes:
- Regular: Swing, Daily RTH session, Daily ETH Session
- Oscillator: Swing, Daily RTH session, Daily ETH Session
- Anchored VWAP
- Anchored VWAP/TWAP with Standard Deviations
VWAP values for higher timeframes are internally calculated using 1-minute granularity. This offers accurate values for the given timeframes while speeding up computations to offer results in reasonable times and produce faster chart refresh times. Only time-based charts are supported (Data series type of Minute or Day – for example 1-Minute, 5-Minute, 60-Minute, 1-Day). The Calculate mode in Indicator Properties is set to OnBarClose and cannot be changed. This method is in effect in the following modes and timeframes:
- Regular: Weekly, Monthly, Quarterly, Yearly
- Oscillator: Weekly, Monthly, Quarterly, Yearly
- Rolling VWAP
Understanding ZigZag:
The current developing ZigZag leg will extend as price continues to move in the same direction, or it can reverse if price moves sufficiently in the opposite direction to form a new swing. As one leg is solidified and a new leg is formed, VWAP values that are anchored to swing legs are recalculated and the chart is redrawn to reflect the new swing points. This is normal behavior. The following excerpt is provided to further expand on ZigZag’s behavior.
Note from NinjaTrader ZigZag document:
