Volume Profile User Guide
Volume Profile Indicator Highlights
This indicator is included in our Orderflow Package and is also available as a standalone product.
- Many pre-configured or user-specified timeframes:
- Current Swing Leg (Leg to leg profile)
- Current RTH or ETH sessions
- Current Week or Month
- Since a specified time
- During a specified time span
- Rolling number of Minutes, Days or Weeks
- Entire chart
- Chart visible range
- Custom range using visual selection tool
- Volume by Price, Delta by Price or both on the same chart
- Value Area, Threshold based filtering, Gradient coloring
- Automated HVN & LVN drawings
- Highly customizable Volume by Price and Delta by Price profiles
- Great flexibility in layout, placement, orientation and sizing of Volume and Delta profiles
- Ability to show Value Area (VAH, VAL, VPOC) with Volume by Price
- Tick compression with ability to select values for Volume and Delta profiles independently
- Ability to hide chart bars
- Streamlined User Interface and intuitive grouping of Indicator Properties
- Does not require NinjaTrader’s Lifetime license
- Does not require Tick Replay
Adding and Removing Indicators
To add or remove indicators on your charts, consult NinjaTrader’s ‘Working with Indicators’ documentation for step-by-step guidance.
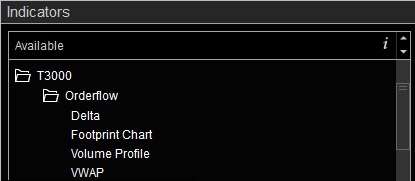
After installing the Orderflow package, you will find this indicator in the T3000/Orderflow folder within NinjaTrader’s Indicators menu.
User Guide
The following list of options and menus are available in this indicator and will be discussed in detail in the following sections.
Settings:
The contents of this menu are context sensitive. The inputs shown in this menu will depend on selected options.
Profile Timeframe: This input selects the timeframe for which the profile is calculated. The following profile timeframes are available. Each selection may contain additional input parameters that correspond to the chosen Profile Timeframe.
- Current Swing Leg (1): Shows the profile for the most current swing (as determined using ZigZag).
- Current RTH Session (2): Shows the profile for the current Regular Trading Hours (RTH) session.
- Current ETH Session: Shows the profile for the current Extended Trading Hours (ETH) session.
- Current Week: Shows the profile for the current Week. Starting time for this profile is the opening time for the first Globex session of the most recent week (generally Sunday Globex open).
- Current Month: Shows the profile for the current Month. Starting time for this profile is the opening time for the first Globex session of the most recent month.
- Start Time (3): Shows the profile for all available data on the chart starting from the specified time to current time. Start Time must be within the range of available data on the chart.
- Time Span (4): Shows the profile for all available data on the chart between specified Start and End times. Start Time must be within the range of available data on the chart. If End Time is set to a future time, the profile will be calculated between Start Time and current time and will continue to update until End Time is exceeded.
- Number of Minutes (5): Shows the profile for a rolling number of minutes as selected by the Number of Minutes input.
- Number of Days (5): Shows the profile for a rolling number of days (full ETH sessions) as selected by the Number of Days input.
- Number of Weeks (5): Shows the profile for a rolling number of weeks as selected by the Number of Weeks input. Starting time for this profile is the opening time for the first Globex session (Sunday) of the first week in the group of weeks.
- Entire Chart: Shows the profile for all data that has been loaded on the chart.
- Chart Visible Range: Shows the profile only for data that is currently visible on the chart panel. As the chart panel is moved, compressed or expanded, the display will adjust in real time to show the profile corresponding to all visible data on the chart panel.
- Selected Range (6): Shows the profile for data within the two edges of a manually drawn Region Highlight X drawing object. As the Region Highlight X drawing object is drawn or updated, the profile will adjust in real time to reflect data that falls within the Region Highlight X drawing object. Only one Region Highlight X drawing object may be on the chart at any given time.
(1) If Profile Timeframe is set to “Current Swing Leg”, the following settings will be available: view image
- Rotation Size (points): Defines the Deviation Value for the ZigZag routine which determines how swings are calculated and when they reverse. This value is in the units of points for the selected instrument.
- Show Current Swing Start Point: Enabling this option will place a marker on the chart that visually identifies the starting time of the most recent swing that is being used to calculate the displayed profile.
- Highlight Current Swing: Enabling this option will highlight price bars in the current swing leg to visually identify which price bars are used to calculate the displayed profile.
- Start Point: Settings in this input group define the visual characteristics of the marker used to show the current swing start point.
- Highlight: Settings in this input group define the visual characteristics of the highlighted region that marks the current swing.
- RTH Session Template: This input selects the Regular Trading Hours session template which determines RTH session start and end times. Detailed instructions on how to use this input are available here.
- Overlay Profile on Chart: If this option is selected, the profile will be overlaid on the chart. If this option is not selected, the profile will be drawn on the right or left side of the chart panel as configured in the Profile Configuration section. view image
- Highlight Settings: Settings in this input group customize the appearance of the manually drawn Region Highlight X drawing object used to mark the start and end points of the range that determines the profile duration.
Profile Configuration:
This menu includes various settings that define the Profile characteristics.
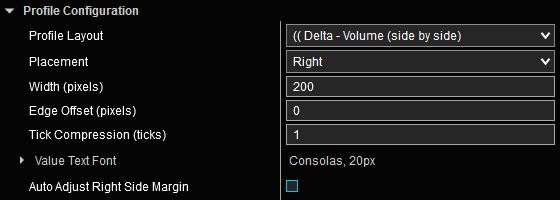
Profile Layout: Selects the Profile layout from a list of available options. All combinations of Delta by Price, Volume by Price, or both are offered along with every possible combination of alignments and orientations. The parenthesis characters at the beginning of the layout name indicate the orientation of Volume and Delta profiles. For example, in the image shown above, the Profile will include Delta and Volume profiles side by side. Delta profile will be on the left and Volume profile will be on the right with both profiles pointing to the left as indicated by the parenthesis.
Placement: Determines whether the Profile is placed at the Right or Left edge of the chart panel.
Width (pixels): Determines the total width of the profile in pixels.
Edge Offset: Determines the distance between profile edge and chart panel edge in pixels. view image
Tick Compression (ticks): Determines the number of price levels (in ticks) that are aggregated together per each step of the Profile.
Value Text Font: Customizes the font used to show Profile values.
Auto Adjust Right Side Margin: Enabling this option will automatically expand the chart’s right side margin in such a way that price bars cannot enter the Profile drawing area. If this option is disabled, the right side margin can be adjusted manually as needed from Chart Properties menu. This option is only present if the Placement is set to Right.
Important: Please note that if multiple instances of this indicator are placed on the same chart, or if several indicators that provide this option exist on the same chart, ensure that only one indicator instance has this option activated. Activating this option on multiple indicators on the same chart could lead to simultaneous adjustments of the right margin, potentially causing erratic behavior.
Additional Right Side Margin (pixels): If Auto Adjust Right Side Margin is enabled and additional space is required on the right side margin, this input will add the specified number of pixels to provide the extra margin.
Delta Profile:
This menu is only present if the selected Profile Layout includes Delta by Price. It includes various settings that apply to Delta by Price portion of the Profile. This menu is context sensitive. The inputs shown in this menu will depend on selected options.
Coloring Mode: This option selects how the Delta Profile steps are colored.
- Threshold Based: Delta Profile steps with values exceeding threshold and those below threshold are colored using different colors. Colors can be customized in the Profile Colors section. view image
- Gradient: Delta Profile steps are colored with varying brightness based on Delta values; brighter colors for larger values and darker colors for smaller values. Max Opacity and Min Opacity values in the Color Gradients Settings section determine the shade of the color for maximum and minimum (zero) Delta values on the profile. The Steps parameter determines the number of shades that will be used to represent different values in between. A larger value for Steps corresponds to more shades. view image
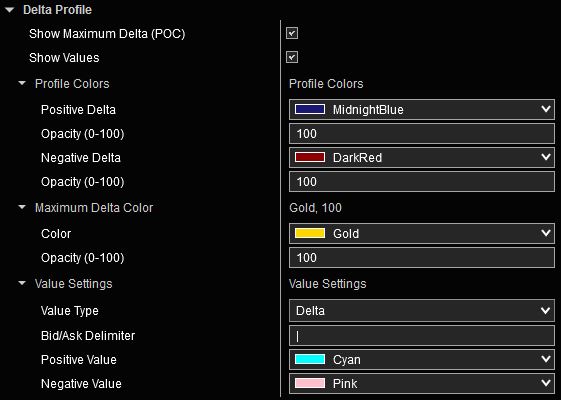
Show Maximum Delta (POC): Enabling this option will highlight the Delta Profile level corresponding to delta with the largest absolute value (Point of Control). This value may be positive or negative. You may customize the appearance of the POC by updating the Maximum Delta Color settings.
Show Values: Enabling this option will show the Delta values at each price level. If price scale is too compressed and there isn’t enough space to display values on the Profile, values will not be displayed. Expand the price scale until Profile values appear. Settings in the Value Settings section can be used to customize the appearance of Delta value text.
- Value Type: Selects the value shown on the Delta profile. The options are: Delta, Bid/Ask volume or both.
- Bid/Ask Delimiter: If Bid/Ask volume values are shown, this value will be used as separator between Bid and Ask volume values.
- Hide Values Below Threshold: When enabled, this option hides text for levels where the absolute value of Delta falls below the specified threshold.
- Color settings are available for value text corresponding to various conditions.
Volume Profile:
This menu is only present if the selected Profile Layout includes Volume by Price. It includes various settings that apply to Volume by Price portion of the Profile. This menu is context sensitive. The inputs shown in this menu will depend on selected options.
Coloring Mode: This option selects how the Volume Profile steps are colored.
- Threshold Based: Volume Profile steps with values exceeding threshold and those below threshold are colored using different colors. Colors can be customized in the Profile Colors section. view image
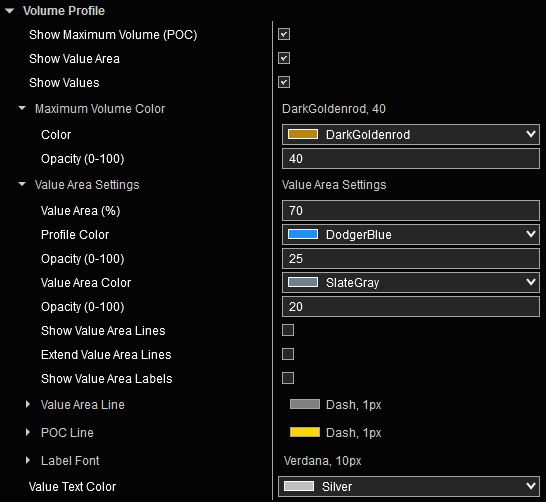
- Value Area: Enabling this option will display the Volume Profile as a Value Area. Value Area properties and colors can be customized from the Value Area Settings menu. view image
- Gradient: Volume Profile steps are colored with varying brightness based on Volume values; brighter colors for larger values and darker colors for smaller values. Max Opacity and Min Opacity values in the Color Gradients Settings section determine the shade of the color for maximum and minimum (zero) Volume values on the profile. The Steps parameter determines the number of shades that will be used to represent different values in between. A larger value for Steps corresponds to more shades. view image
Show Maximum Volume (POC): Enabling this option will highlight the Volume Profile level corresponding to the largest volume value (Point of Control). You may customize the POC appearance by updating the Maximum Volume Color value.
Show Values: Enabling this option will show Volume values at each price level. If price scale is too compressed and there isn’t enough space to display values on the Profile, values will not be displayed. Expand the price scale until Profile values appear. The Value Settings menu can be used to customize the appearance of Profile value text.
Volume Threshold: Profile levels with Volume values above and below this Threshold value can be customized with different colors and opacity levels to highlight their differences.
HVN & LVN (High & Low Volume Nodes):
This menu is only present if the selected Profile Layout includes Volume by Price. It includes various settings that modify the behavior and characteristics of HVN (High Volume Node) and LVN (Low Volume Node) drawings. This menu is context sensitive. The inputs shown in this menu will depend on selected options.
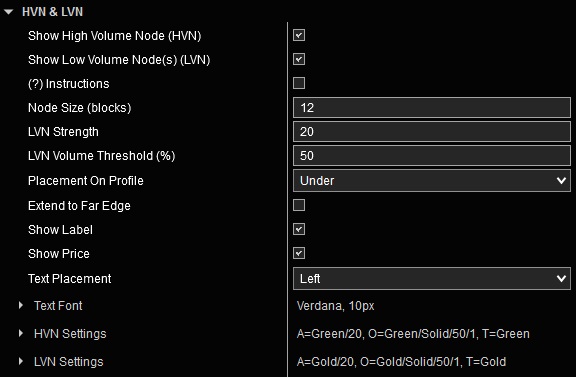
Show High Volume Node (HVN): Enable this option to draw the Volume Profile High Volume Node.
Show Low Volume Node (HVN): Enable this option to draw the Volume Profile Low Volume Node(s). A Volume Profile may have no LVN, one LVN or multiple LVNs depending on selected criteria.
Node Size: This parameter sets the width of each node in the volume profile, measured in the number of price blocks. Each price block may include multiple price levels, as defined by the Tick Compression value. The total node width is calculated as: Node Size × Tick Compression. For example, if Node Size is 3 and Tick Compression is 4, each node spans 12 price levels or ticks.
LVN Strength: This setting controls the criteria for identifying Low Volume Nodes (LVNs) in the volume profile. An LVN is a price range where the total trading volume is lower than that of the adjacent nodes on both sides. This parameter defines how many neighboring nodes are compared on each side to classify a node as an LVN. A higher value increases the number of adjacent nodes considered, resulting in fewer LVNs being identified.
LVN Volume Threshold (%): This parameter determines the minimum volume difference required for a node to be classified as a Low Volume Node (LVN). For a node to qualify as an LVN, at least one adjacent node on either side, within the range of nodes defined by the LVN Strength setting, must have a total volume that exceeds the node’s volume by this percentage. A higher value requires a greater volume difference between the node and at least one of its neighboring nodes resulting in fewer nodes being identified as LVNs.
Placement On Profile: Determines whether HVN/LVN drawings are displayed Over or Under the Volume Profile.
Extend to Far Edge: When enabled, this option extends HVN/LVN drawings across the entire chart to the opposite edge.
Enabling Show Label and Show Price will add labels to HVN/LVN drawings, indicating the node type and price levels.
Text Placement: Determines the location of HVN/LVN Label and Price.
Text Font: Allows customization of the font used for HVN/LVN Label and Price text.
HVN Settings and LVN Settings provide options to customize the appearance of HVN/LVN drawings.
Understanding ZigZag:
The current developing ZigZag leg will extend as price continues to move in the same direction, or it can reverse if price moves sufficiently in the opposite direction to form a new swing. As one leg is solidified and a new leg is formed, the profile can get recalculated and redrawn to reflect the new swing point. This is normal behavior. The following excerpt is provided to further expand on ZigZag’s behavior.
Note from NinjaTrader ZigZag document:
