Plot Appearance Menu
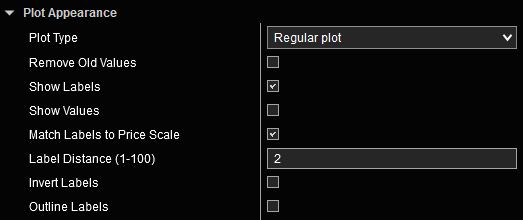
The Plot Appearance menu is a standard feature in all our indicators that include plots. The functions and features described below will work the same way regardless of which indicator is used. The list of parameters in this menu that are available for customization are context sensitive and will depend on the selected Plot Type or other options.
The following options are available in this menu:
Plot Type:
- Regular Plot: Shows a line plot for all values. A complete history of all the levels and where they transitioned is shown. Enabling Remove Old Values in this mode will remove older plots and only show current values. Label Distance adjusts the distance between Plot Labels and the most recent price bar.
- Line at plot edge: Shows a line segment representing the value of each plot corresponding to the rightmost visible price bar. Plot lines are aligned with the right edge of the primary chart. As you scroll the time axis, the levels will adjust to the value of the plot at the time of the rightmost visible price bar. The length of the line can be adjusted using the Total Width input.
- Line at right edge: Shows a line segment representing the value of each plot corresponding to the rightmost visible price bar. Plot lines are aligned with the right edge of the chart panel. As you scroll the time axis, the levels will adjust to the value of the plot at the time of the rightmost visible price bar. The line length and offset from the panel edge can be adjusted using Total Width and Edge Offset inputs.
- Line at left edge: Shows a line segment representing the value of each plot corresponding to the rightmost visible price bar. Plot lines are aligned with the left edge of the chart panel. As you scroll the time axis, the levels will adjust to the value of the plot at the time of the rightmost visible price bar. The line length and offset from the panel edge can be adjusted using Total Width and Edge Offset inputs.
Show Labels: Enabling this option will show plot names for all enabled plots. Label color will match the corresponding plot color.
Show Values: Enabling this option will add values to plot labels.
Match Labels to Price Scale: Selecting this option will render all plot labels with the same font as the price scale. If this option is deselected, the Label Font input will become visible which will allow the customization of label fonts.
Invert Labels: Selecting this option will render all plot labels with inverted colors.
Outline Labels: Selecting this option will render all plot labels with an outline. If this option is selected, options for Outline Dash Style and Outline Width will become available which will allow the customization of the label outline.


