MGI Statistics User Guide
Market Generated Information (MGI) is a collection of objective data derived from the market’s past behavior. This data is used to analyze market structure and context, identifying significant areas of price action that could potentially serve as Support and Resistance in the near future.
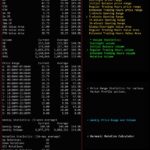
The MGI Statistics indicator provides various statistics and averages to help characterize market’s recent behavior in an effort to gain awareness of recent tendencies and context to help guide trading decisions. To avoid skewing results, any holidays and short trading sessions are excluded from consideration during calculations.
MGI Statistics Indicator Highlights
This indicator is included in our MGI Package.
- Comprehensive list of commonly used market statistics and averages
- Price-based and Orderflow-based averages
- Price range and trading volume averages
- Daily and weekly averages
- Harmonic Rotation calculator
- Inline Tooltips on Indicator Properties menu
- Highly customizable and easy to use
Adding and Removing Indicators
To add or remove indicators on your charts, consult NinjaTrader’s ‘Working with Indicators’ documentation for step-by-step guidance.
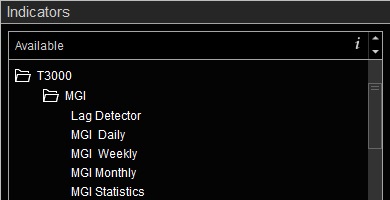
After installing the MGI package, you will find this indicator in the T3000/MGI folder within NinjaTrader’s Indicators menu.
MGI Statistics User Guide
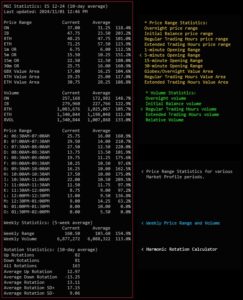
The following list of options and menus are available in this indicator and will be discussed in detail in the following sections. Please note that this user guide covers all features available in our Premium MGI package. The Free MGI package may not include certain features that are discussed below. Features that are not available in the Free MGI package will be clearly marked in Indicator Properties on the free version.
Settings:
The Settings menu consists of the following inputs:
RTH Session Template: Selects the Regular Trading Hours session template which determines RTH session start and end times. Detailed instructions on how to use this input are available here.
Number of Days for Daily Statistics: This input determines the number of days used in daily averages which can be selected in the Daily Statistics menu below.
Number of Weeks for Daily Statistics: This input determines the number of weeks used in weekly averages which can be selected in the Weekly Statistics menu below.
Value Area (%): Percentage of trading volume used for Value Area Calculations. This input is only available if any of the Value Area options are enabled in Plot Groups to Show section.
Value Area Calculation Tick Compression: This parameter determines the number of price levels that are combined together prior to Value Area calculations. This input is only available if any of the Value Area options are enabled in Plot Groups to Show section.
With Tick Compression of 2, sum of volumes from the next two price levels above the POC are compared to sum of volumes from the next two price levels below the POC. This process is repeated until the desired percentage of volume is reached. With Tick Compression of 1, volume from each price level is considered separately which allows for a more granular Value Area calculation. The traditional method for calculating Value Area uses Tick Compression of 2 price levels.
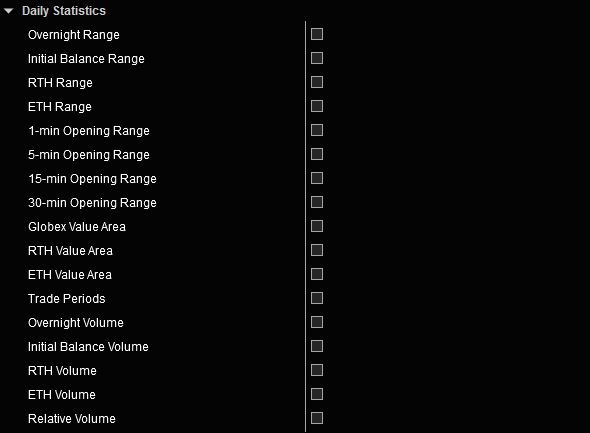
Daily Statistics
This section allow you to select which daily averages are displayed. The current list of available daily averages are shown in the image above.
Weekly Statistics
This section allow you to select which weekly averages are displayed. The current list of available weekly averages are shown in the image above.
Rotation Calculator
The Harmonic Rotation calculator is based on a 1-minute data series. Fractal Swing High/Low points are determined by comparing a price bar to the Highs/Lows of N bars before and after the current bar being evaluated (Look Back and Look Forward). The value of N is configurable through the Rotation Sequence input as explained below.
Session Start Time and Session End Time determine the time period during the trading session when price swings are considered for Rotation calculations. Times are in the Time zone of your platform as configured in Tools > Options > General > Time zone.
Rotation Lookback is the number of days of data that are considered in Rotation calculations.
Rotation Sequence determines the number of Look Back and Look Forward values as used in Harmonic Rotation calculator. The Fast setting is configured in such a way that more rotations with smaller swing sizes are considered, while the Slow setting yields fewer rotations with larger swing sizes. You may also specify the Look Back and Look Forward values by selecting the Custom setting.
Report Type determines if results will be shown in Summary or Detailed format.
Std Deviation settings will calculate values that are above and below the average value by a configurable multiple of the Standard Deviation value. This configurable multiplier can be selected using the Std Deviation Multiplier input.
Round to Nearest Tick: When this option is set, results being displayed are rounded to the nearest tick size for the given instrument.
Information Table
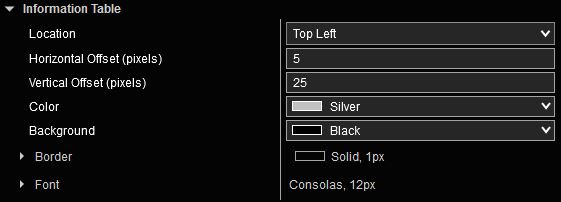
This menu includes inputs that allow you to specify the precise location of the Information Table which includes the various calculated statistics.
Location selects which corner of the chart the Information Table will be placed.
Horizontal Offset and Vertical Offset are measured in pixels from the edges of the chart and allow for precise placement of the Information Table. Adjust these settings to fine tune the location of the table on the chart.
Color, Background, Border and Font parameters allow further customizations of the various visual aspects of the Information Table.
Data Series Considerations:
To accurately compute values for Daily Statistics and Rotation Calculator, sufficient number of days must be loaded in Data Series to include the necessary number of active trading days for calculations. If not enough days are available to perform the required calculations, an error message will be displayed.
The timeframe of the Data Series does not affect results generated by the indicator. You may choose any timeframe in Data Series. However, if MGI Statistics is the only indicator loaded on the chart, selecting a time based series (such as 1-min or 5-min) will reduce system resource requirements and improve overall performance.
The Regular Trading Hours (RTH) template required for RTH calculations is set in the Settings section of Indicator Properties. To ensure accurate calculations, please set Trading Hours template to <Use instrument settings> in Data Series properties.
Weekly Statistics calculations use a different mechanism and automatically load sufficient amount of data required for calculations independently of number of days loaded in Data Series. Therefore, for Weekly Statistics, it is not required to load as many days in Data Series.
For best performance, only load enough days that are required for Daily Statistics and Rotation Calculator.
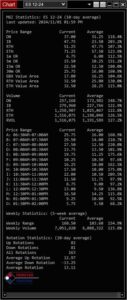
Tip: How to display MGI Statistics on a standalone window with nothing else
- Open a new chart (New > Chart) and configure Data Series (guidelines).
- Remove any other indicators from the chart.
- Only add the MGI Statistics indicator.
- In Data Series properties:
- change “Chart style” to “Line on Close” and set color to Transparent.
- set “Price marker” to not be visible.
- set “Scale justification” to “Overlay”.
- In Chart Properties
- set all grid lines and any other colors to Transparent.
- set “Right side margin” to 0.
- In Indicator Properties: set “Scale justification” to “Overlay”.
- Resize the chart window to only include the MGI Stats table.

