Footprint Chart User Guide
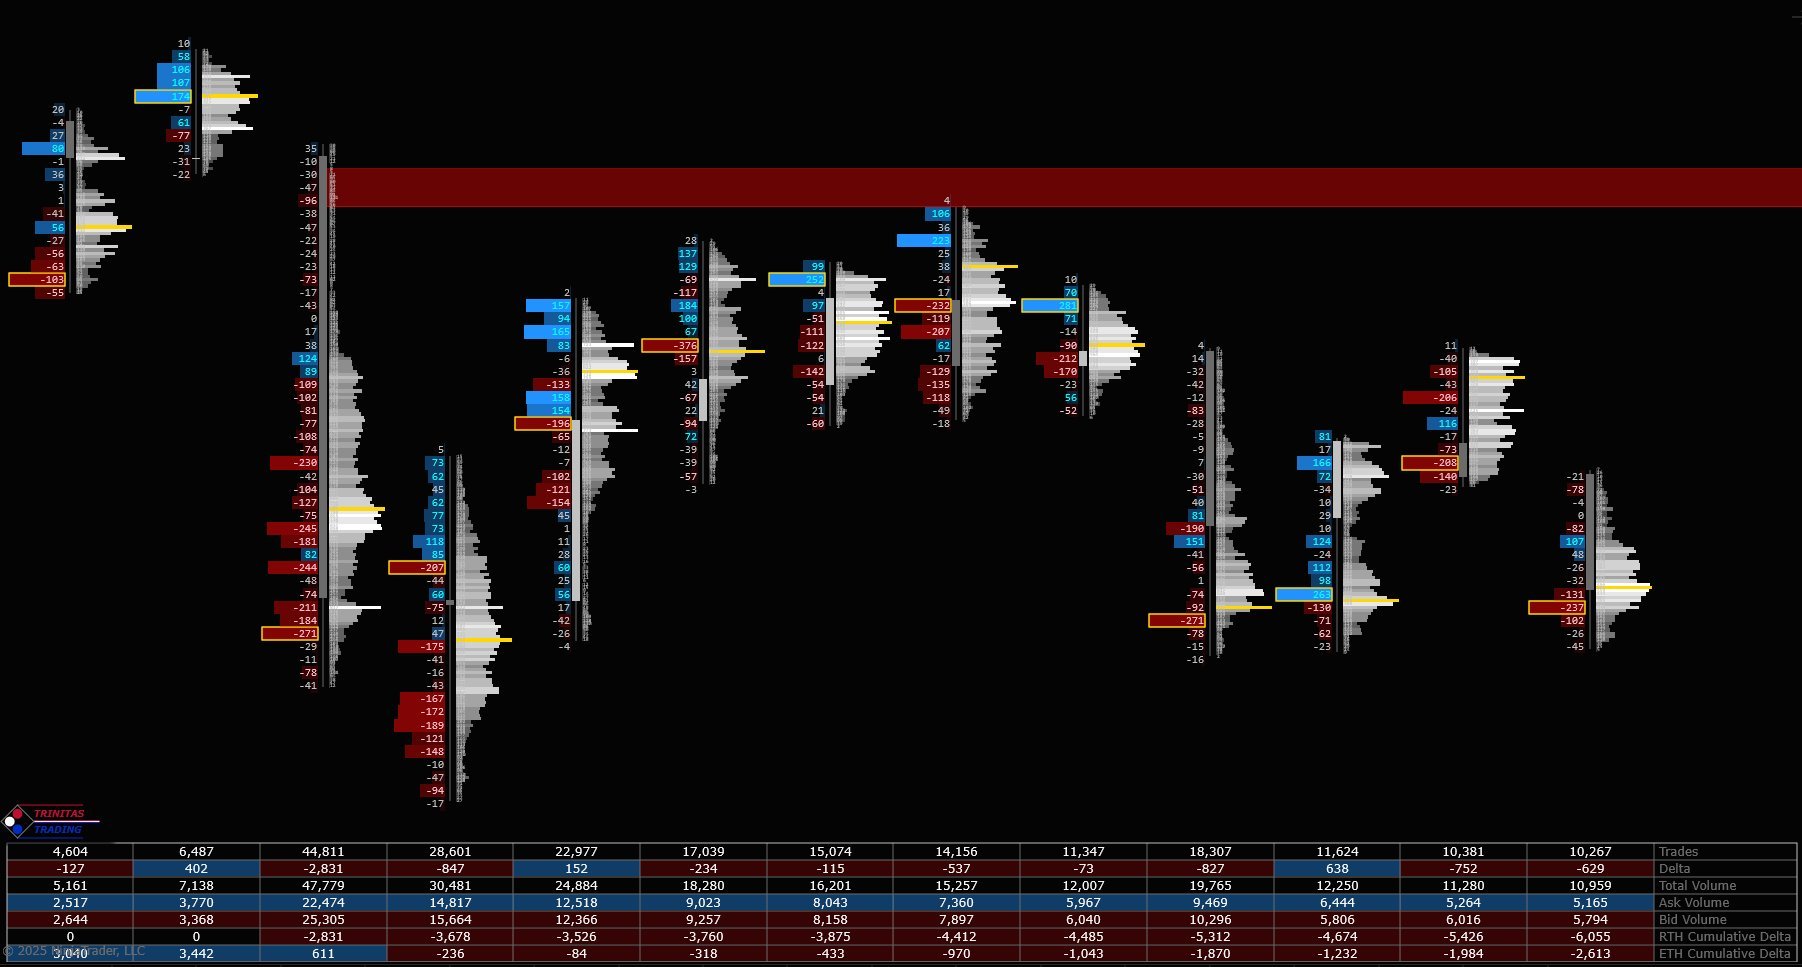
A Footprint Chart offers a detailed view of traded volume, aggressive buying/selling (ask/bid volume), and delta at each price level. This deeper insight reveals orderflow data not visible on standard price charts. Plus, the Bar Information Table neatly summarizes key bar data in a concise format.
Footprint Chart Indicator Highlights
This indicator is included in our Orderflow Package and is also available as a standalone product.
- Supported on many commonly used bar types:
- NinjaTrader builtin bar types: Tick, Volume, Range, Second/Minute, Day, Heiken-Ashi, Renko, Point & Figure
- Third Party bar types: ninZa Renko, Uni Renko
- Ability to choose Volume by Price, Delta by Price or both on the same chart
- Highly customizable Volume and Delta profiles
- Great flexibility in layout, placement, orientation and sizing of Volume and Delta profiles
- Various coloring options: Threshold-based, Value Area, Imbalance, Gradient
- Ability to show Value Area (VAH, VAL, VPOC) with Volume by Price
- Buy/Sell Imbalances
- Stacked Imbalances and Imbalance Zones
- Trapped Traders Zones
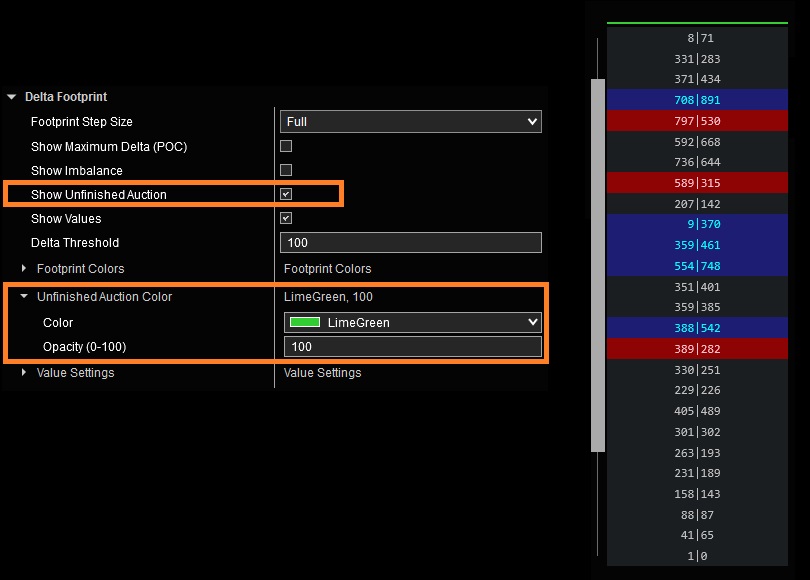
- Unfinished Auction
- Threshold based highlighting
- Tick compression with ability to select values for Volume and Delta footprints independently
- Highly customizable Information Table with rows that can be reordered
- Flexible placement of Information Table (top or bottom of chart)
- Comprehensive list of widely used values to display in Information Table
- Ability to hide chart bars
- Streamlined User Interface and intuitive grouping of Indicator Properties
- Does not require NinjaTrader’s Lifetime license
- Does not require Tick Replay
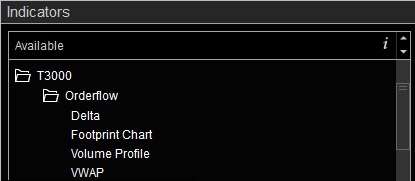
Adding and Removing Indicators
To add or remove indicators on your charts, consult NinjaTrader’s ‘Working with Indicators’ documentation for step-by-step guidance.
After installing the Orderflow package, you will find this indicator in the T3000/Orderflow folder within NinjaTrader’s Indicators menu.
User Guide
The following list of options and menus are available in this indicator and will be discussed in detail in the following sections.
Settings:
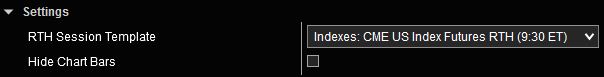
RTH Session Template: This input selects the Regular Trading Hours session template which determines RTH session start and end times required for various calculations. Detailed instructions on how to use this input are available here.
Hide Chart Bars: Enabling this option will remove price bars and only leave the Footprint. Otherwise, price bars and Footprint will be visible.
Footprint Configuration:
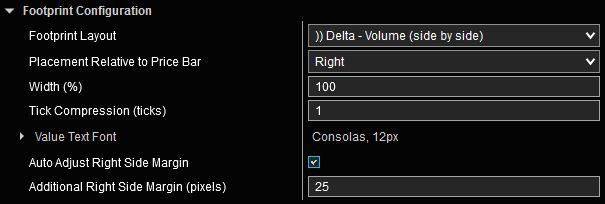
This menu includes various settings that define the Footprint characteristics.
Footprint Layout: Selects the Footprint layout from a list of available options. All combinations of Delta by Price, Volume by Price, or both are offered along with every possible combination of alignments and orientations. The parenthesis characters at the beginning of the layout name indicate the orientation of Volume and Delta profiles. For example, in the image shown above, the Footprint will include a Delta and Volume profiles side by side. Delta profile will be on the left and volume profile will be on the right with both profiles pointing to the right.
Placement Relative to Price Bar: Selects which side of price bar the Footprint is placed.
Width (%): Adjusts what percentage of the available space between two consecutive price bars is used to display the Footprint.
Tick Compression (ticks): Selects the number of price levels (in ticks) that are aggregated together per each step of the Footprint.
Value Text Font: Customizes the font used to display Footprint values.
Auto Adjust Right Side Margin: Enabling this option will automatically adjust the chart’s right side margin in such a way as to correctly align the right end of the Footprint and Information Table with the right edge of the chart panel. If this option is disabled, the right side margin can be adjusted manually as needed.
IMPORTANT: When using several indicators that provide this option on the same chart, ensure that only one indicator has this option activated. Activating this option on multiple indicators on the same chart could lead to simultaneous adjustments of the right margin, potentially causing erratic behavior.
Delta Footprint:
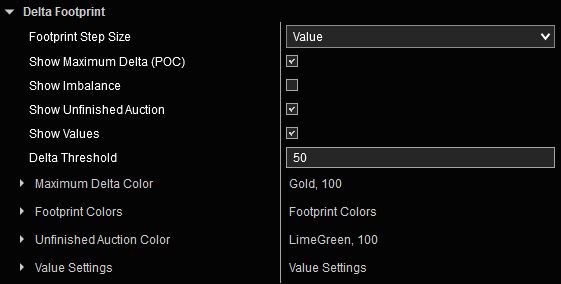
This menu is only present if the selected Footprint Layout includes Delta by Price. It includes various settings that apply to Delta by Price portion of Footprint. This menu is context sensitive. The inputs shown in this menu will depend on selected options.
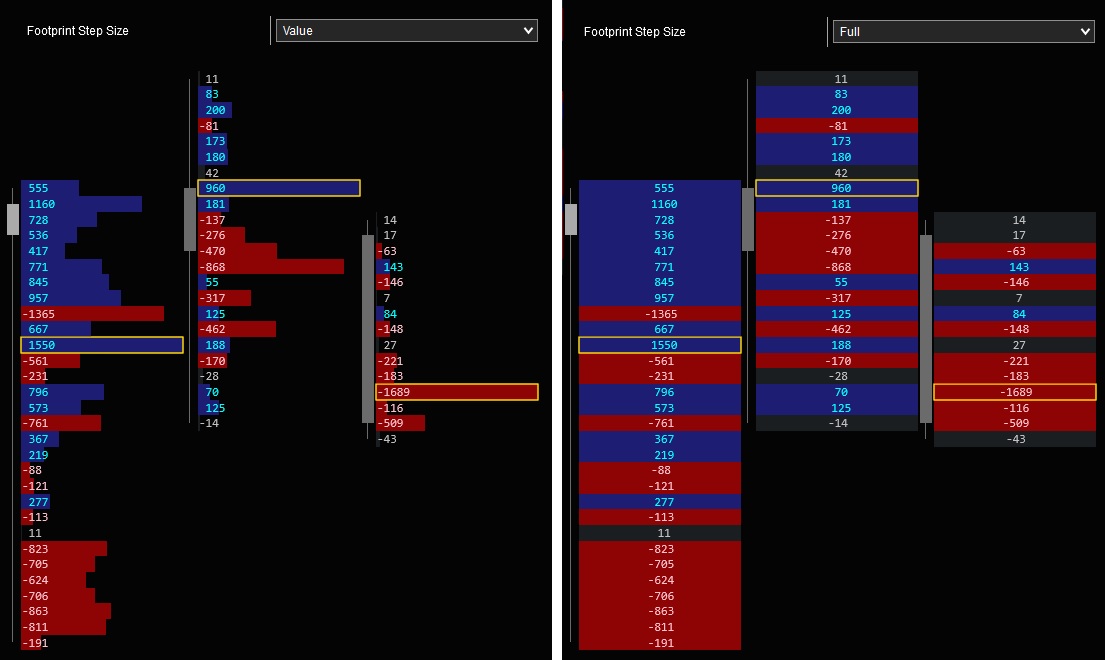
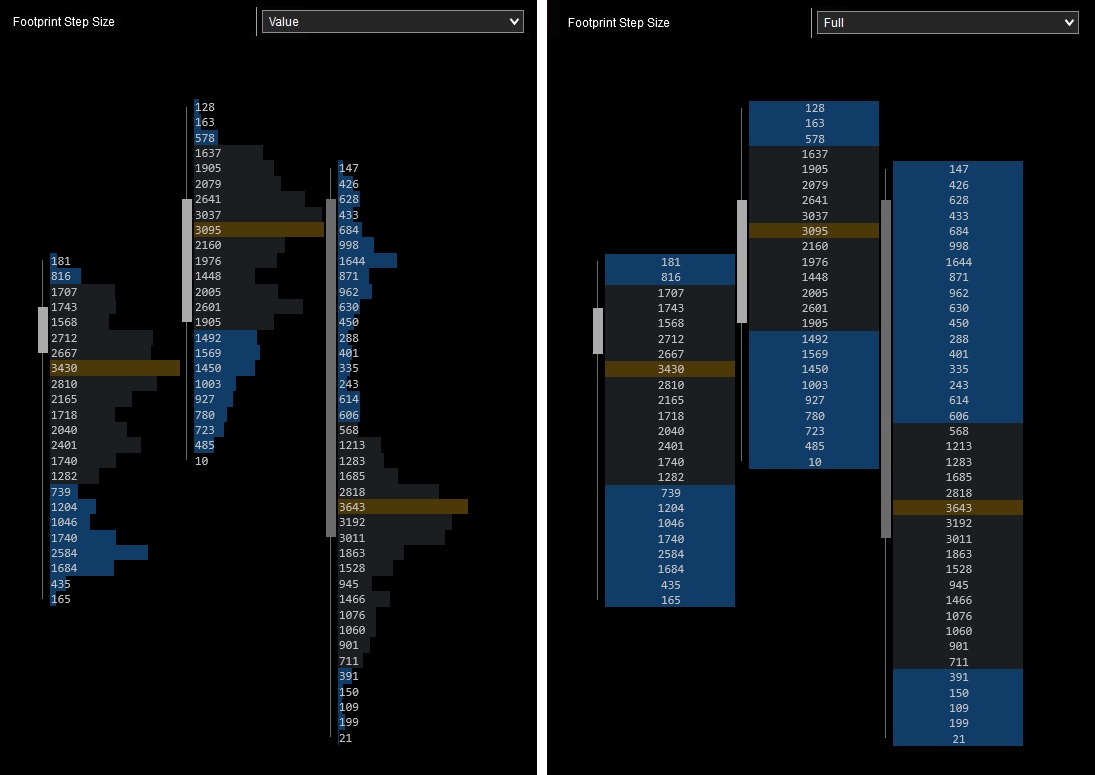
Footprint Step Size: This input determines if Delta Footprint step size is proportional to the Value of Delta or if it is drawn in Full. view image
Coloring Mode: This option selects how the Delta Footprint steps are colored.
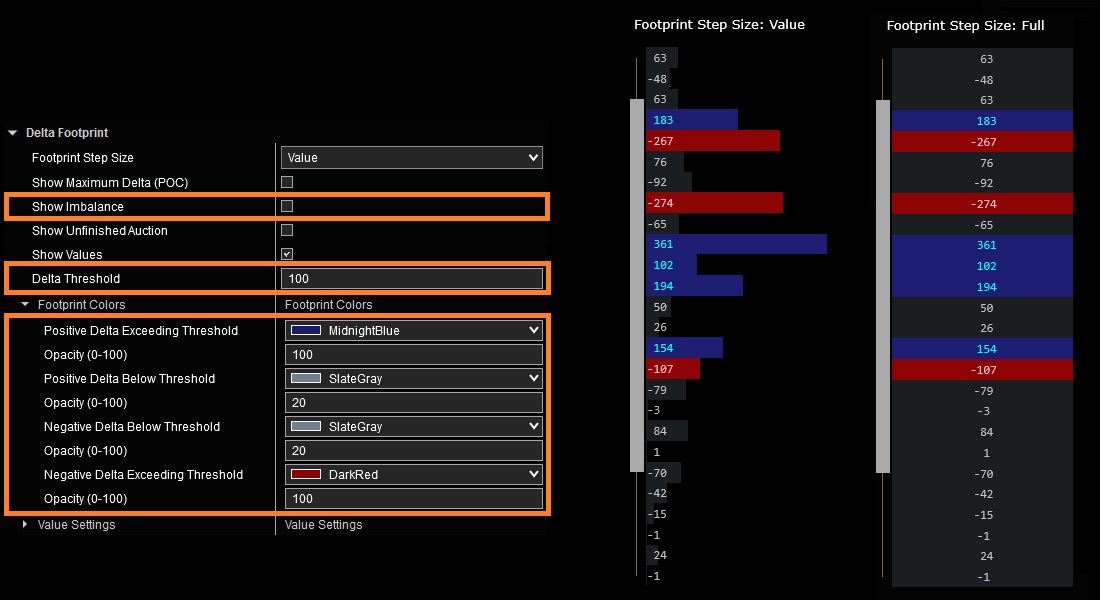
- Threshold Based: Delta Footprint steps with values exceeding threshold and those below threshold are colored using different colors. Colors can be customized in the Footprint Colors section. view image
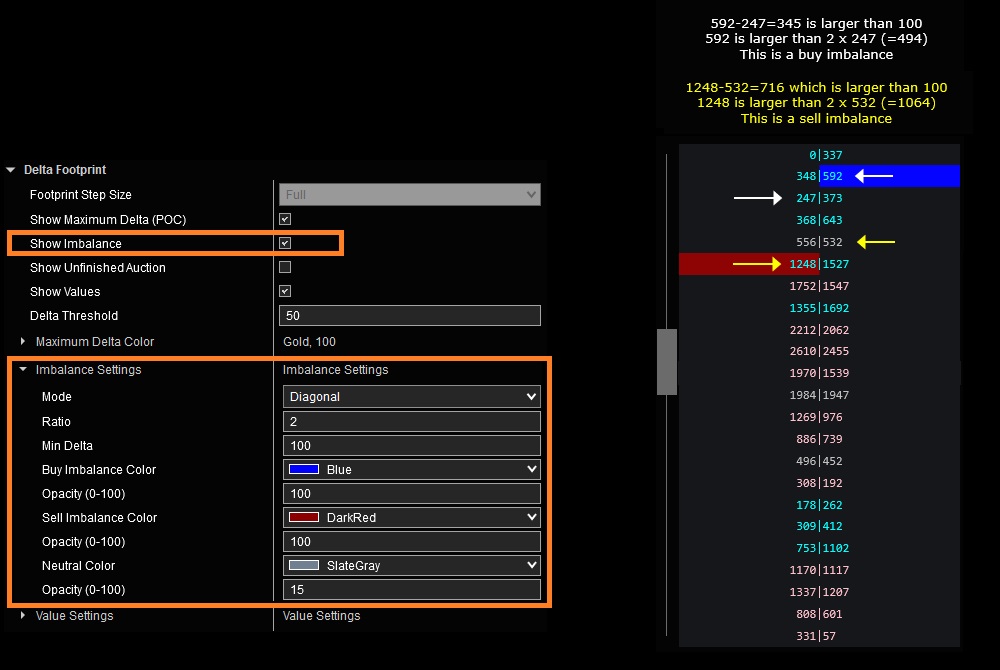
- Imbalance: Buy/Sell imbalances in Delta Footprint are highlighted. The settings in the Imbalance Settings group can be used to update the criteria that identify an imbalance. If Highlight Stacked Imbalances is selected, stacked imbalances will be highlighted with different colors. Colors can be customized in the Imbalance Colors section. view image
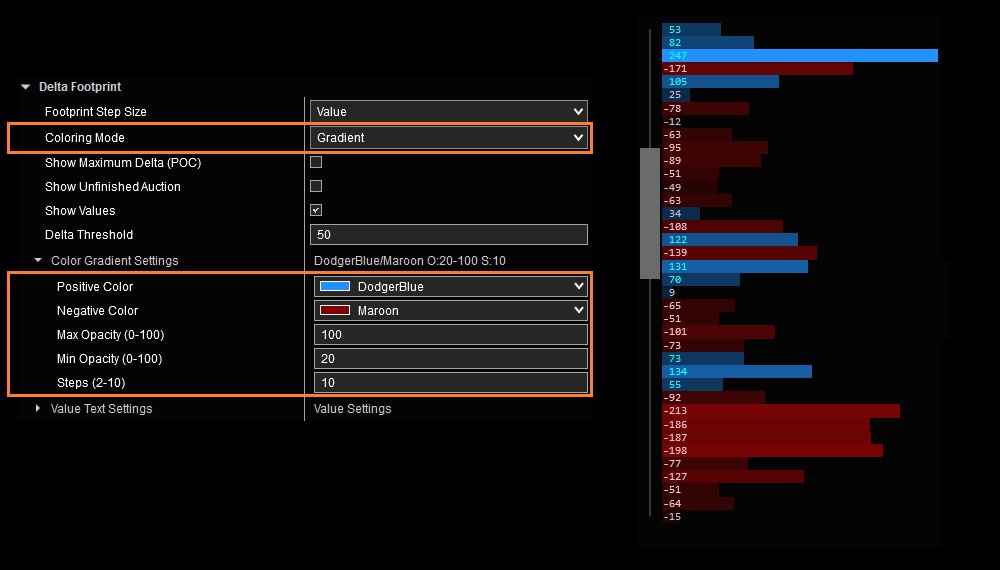
- Gradient: Delta Footprint steps are colored with varying brightness based on Delta values; brighter colors for larger values and darker colors for smaller values. Max Opacity and Min Opacity values in the Color Gradients Settings section determine the shade of the color for maximum and minimum (zero) Delta values on the footprint bar. The Steps parameter determines the number of shades that will be used to represent different values in between. A larger value for Steps corresponds to more shades. The shading for a given Footprint bar is determined based the maximum value of Delta on that bar only and is independent of maximum Delta values on any other Footprint bars. view image
Value Text Settings: Settings in this section customize the appearance of Delta value text. This section is only available when Show Values is selected. The following settings are available:
- Value Type: Selects the value shown on the Delta footprint. The options are: Delta, Bid/Ask volume or both.
- Bid/Ask Delimiter: If Bid/Ask volume values are shown, this value will be used as separator between Bid and Ask volume values.
- Hide Values Below Threshold: When enabled, this option hides text for levels where the absolute value of Delta falls below the specified threshold.
- Color settings for value text corresponding to various conditions.
Volume Footprint:
This menu is only present if the selected Footprint Layout includes Volume by Price. It includes various settings that apply to Volume by Price portion of Footprint. This menu is context sensitive. The inputs shown in this menu will depend on selected options.
Footprint Step Size: This input determines if Volume Footprint step size is proportional to the Value of Volume or if it is drawn in Full. view image
Coloring Mode: This option selects how the Volume Footprint steps are colored.
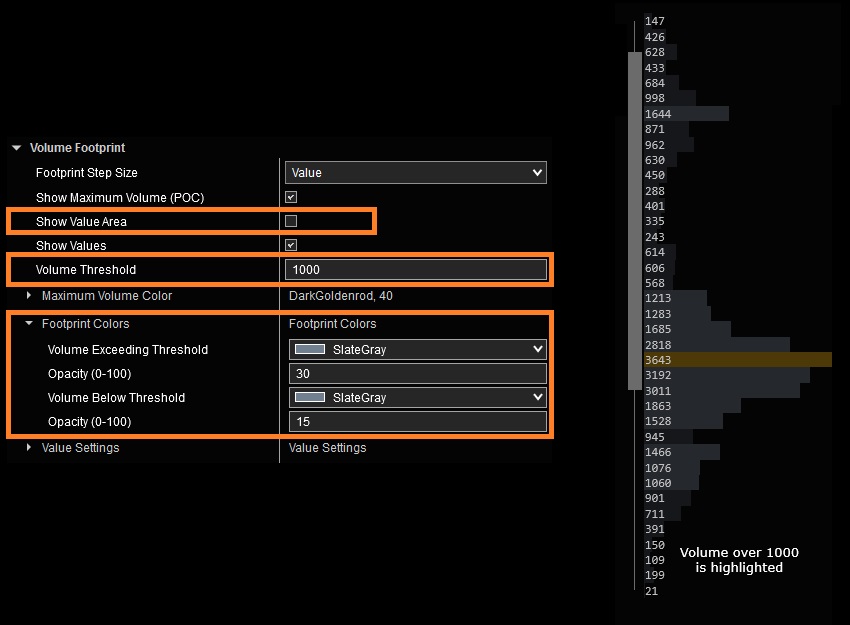
- Threshold Based: Volume Footprint steps with values exceeding threshold and those below threshold are colored using different colors. Colors can be customized in the Footprint Colors section. view image
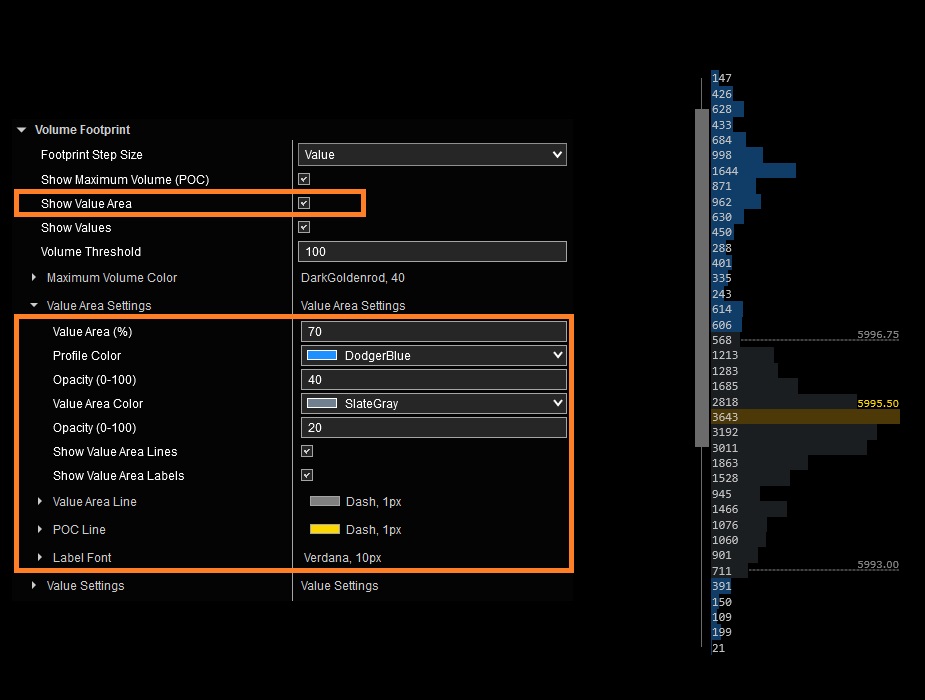
- Value Area: Enabling this option will display the Volume Footprint as a Value Area. Various Value Area properties and colors can be customized from the Value Area Settings menu. view image
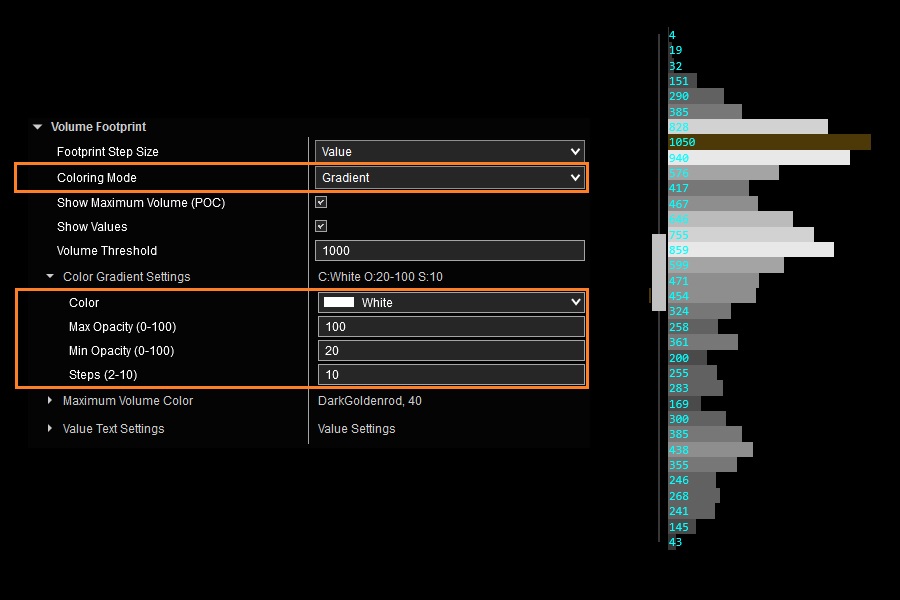
- Gradient: Volume Footprint steps are colored with varying brightness based on Volume values; brighter colors for larger values and darker colors for smaller values. Max Opacity and Min Opacity values in the Color Gradients Settings section determine the shade of the color for maximum and minimum (zero) Volume values on the footprint bar. The Steps parameter determines the number of shades that will be used to represent different values in between. A larger value for Steps corresponds to more shades. The shading for a given Footprint bar is determined based the maximum value of Volume on that bar only and is independent of maximum Volume values on any other Footprint bars. view image
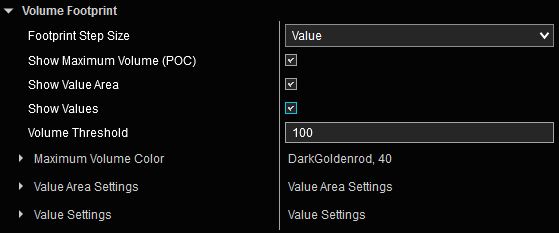
Show Maximum Volume (POC): Enabling this option will highlight the Volume Footprint level corresponding to the largest volume value (Point of Control) for each bar. You may customize the appearance of the POC by updating the settings in the Maximum Volume Color section.
Show Values: Enabling this option will show values at each price level. If price scale is too compressed and there isn’t enough space to display values on the Footprint, values will not be displayed. Expand the price scale until Footprint values appear. Settings in the Value Text Settings section can be used to customize the appearance of Footprint value text.
Volume Threshold: Footprint levels with Volume values above and below this Threshold value can be customized with different colors and opacity levels to highlight their differences.
- Hide Values Below Threshold: Enabling this option will hide text for those levels that have a Volume value below the selected threshold.
- Value Color: Color for text representing the value of Volume at each price level.
Imbalance Settings:
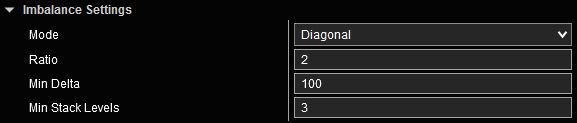
Settings in this section are used to update the criteria that identify an imbalance. Both Ratio and Min Delta conditions are required to mark an imbalance. The following settings are available:
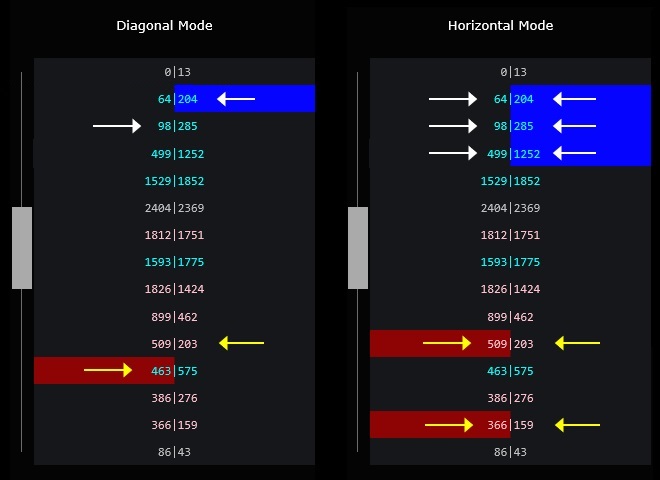
- Mode: In Diagonal mode, the values of Bid and Ask volume are compared diagonally to determine if an imbalance exists. In Horizontal mode, the values of Bid and Ask volume are compared horizontally to determine if an imbalance exists. view image
- Ratio: This value represents the minimum required ratio between Bid and Ask volume that would determine if an imbalance exists. For example if bid volume is 200 and ask volume is 100, this indicates a sell side imbalance of 2x or 200%. Similarly with bid volume of 100 and ask volume of 250, this would indicate a buy side imbalance of 2.5x or 250%.
- Min Delta: This value represents the minimum required positive or negative delta (difference between bid and ask volume) to determine if an imbalance exists.
- Min Stack Levels: Indicates the number of consecutive imbalances that are required to form a Stacked Imbalance.
Stacked Imbalance Zones:
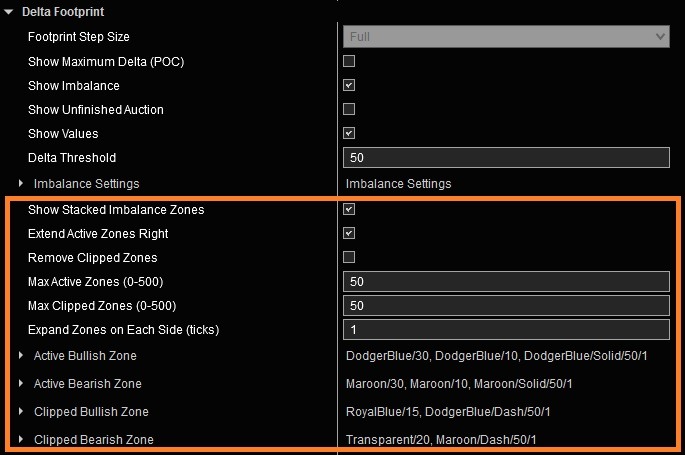
Stacked Imbalance and Trapped Traders Zones can be enabled independently of the selected Footprint layout. You do not need to select a layout configuration that includes Delta to display these zones. Two types of zones are available and can be turned on separately. Both zone types are based on Stacked Imbalance criteria as defined in the Imbalance Settings section.
- Stacked Imbalance Zones: When price aligns with the direction of a stacked imbalance (e.g., rising after positive delta stacked imbalances), market participants are likely to defend the zone if price retraces, potentially triggering a continuation move in the original direction.
- Stacked Trapped Traders Zones: When price moves opposite to a stacked imbalance (e.g., rising after negative delta stacked imbalances near an intermediate low), participants are considered trapped as price moves against them. If price retraces to the zone, these traders are likely to exit positions near breakeven.
Bar Information Table:
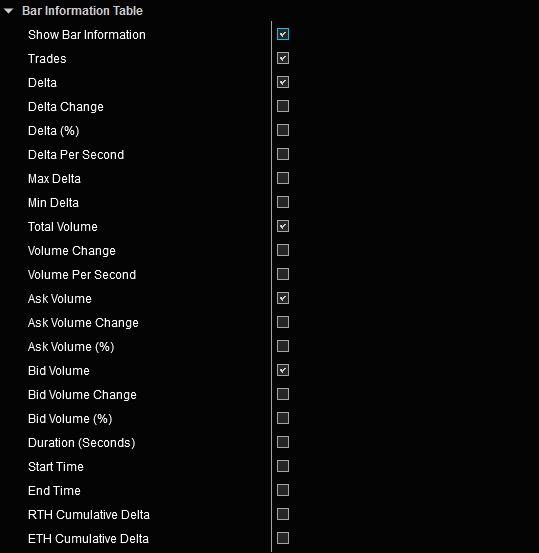
The Bar Information Table summarizes various information gathered from each price bar in a tabular format.
To enable this table, select Show Bar Information. When Show Bar Information is selected, a list of various information that can be shown in the table becomes available.
The following list of values are available to display in the Bar Information Table:
Trades | Total number of trades executed |
Delta | Total delta for bar (difference between aggressive buy volume and aggressive sell volume) |
Delta Change | Change in delta compared to prior bar’s value |
Delta (%) | Delta as percentage of total volume |
Delta Per Second | Delta speed: Total delta divided by duration of the bar |
Max Delta | Maximum delta seen in the bar. This could also be negative if there is no buying pressure |
Min Delta | Minimum delta seen in the bar. This could also be positive if there is no selling pressure |
Total Volume | Total volume for bar |
Volume Change | Change in total volume compared to prior bar’s value |
Volume Per Second | Volume speed: Total volume divided by duration of the bar |
Ask Volume | Total volume transacted at Ask price (aggressive buying volume) |
Ask Volume Change | Change in ask volume compared to prior bar’s value |
Ask Volume (%) | Ask volume as percentage of total volume |
Bid Volume | Total volume transacted at Bid price (aggressive selling volume) |
Bid Volume Change | Change in bid volume compared to prior bar’s value |
Bid Volume (%) | Bid volume as percentage of total volume |
Duration (Seconds) | Time elapsed between first and last trades for a given bar |
Start Time | Time of first trade that formed the bar |
End Time | Time of last trade that formed the bar |
RTH Cumulative Delta | Cumulative Delta value for RTH session. Accumulation of Delta only takes place during RTH hours and resets at the start of RTH session. |
ETH Cumulative Delta | Cumulative Delta value for full ETH session. Accumulation of Delta takes place during the full ETH session and resets at the start of Globex on each day. |
Table Settings:
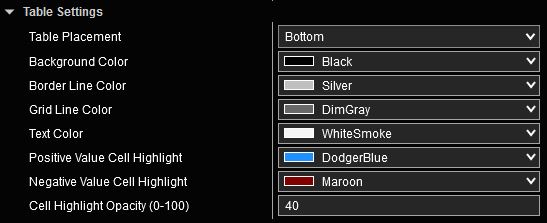
This menu is only present if Show Bar Information is selected.
This section includes various settings that customize the appearance of the Footprint Information Table.
The Information Table can be placed at the top or bottom of the chart panel using the Table Placement setting.
Color options are available to customize various aspects of the Information Table such as Background, Border, Grid, Text and individual Cells.
Cell Highlight Opacity adjusts the transparency level of table cell colors if Positive/Negative highlighting is applied to the cell.
The font used to display the data shown in Information Table matches the font used on the chart scale. It can be adjusted by right clicking on the chart window and then selecting Properties > General > Font.
Table Row Order:
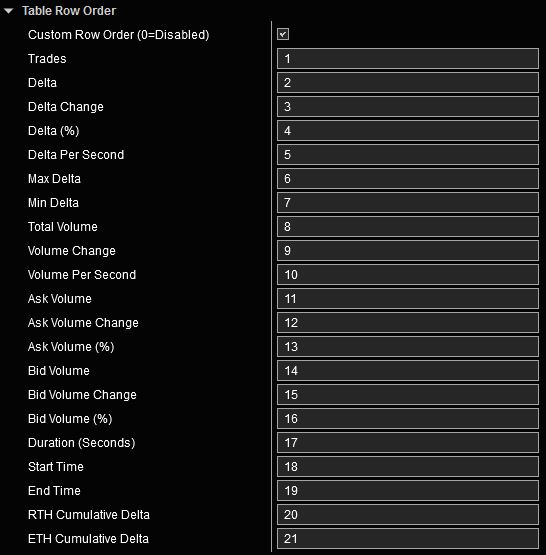
This menu is only present if Show Bar Information is selected.
If Custom Row Order is enabled, the complete list of values that are available to display in Information Table will be shown with their corresponding sequence number. Values with lower sequence numbers will be displayed first and placed higher in the table. By adjusting the sequence number, Information Table values can be reordered as needed.
Setting the sequence value to zero will remove that row from the table.
If multiple table values have the same sequence number, their order will be determined based on the order shown in this menu.