Orderflow Delta User Guide
Delta is a measure of aggressive buyers and sellers in the auction. It represents the difference in volume transacted at Ask Price and volume transacted at Bid Price. Cumulative Delta is the net difference between volume transacted at Ask Price and volume transacted at Bid Price over a period of time.
Orderflow Delta Indicator Highlights:
This indicator is included in our Orderflow Package.
- Multiple ways to represent Delta: raw value, speed and percentage of total transacted volume
- Multiple ways to represent Bid and Ask volume: raw values, speed and percentage of total transacted volume
- Cumulative Delta for Regular Trading Hours (RTH) and Extended Trading Hours (ETH) sessions
- Swing based Delta (also referred to as Leg to Leg)
- Delta Stochastics (to help identify divergences)
- Ability to highlight Delta, Delta Speed, Delta Percent that exceed a configurable threshold
- Enhanced Plots menus allow customization of every aspect of plots including plot names and ability to conveniently turn plots on/off individually
- Does not require NinjaTrader’s Lifetime license
- Does not require Tick Replay
Adding and Removing Indicators
To add or remove indicators on your charts, consult NinjaTrader’s ‘Working with Indicators’ documentation for step-by-step guidance.
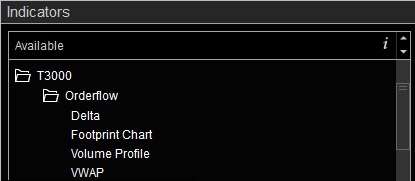
After installing the Orderflow package, you will find this indicator in the T3000/Orderflow folder within NinjaTrader’s Indicators menu.
User Guide
The following list of options and menus are available in this indicator and will be discussed in detail in the following sections.
Settings:
The Settings menu is context sensitive. The selected value for Delta Type will determine what other settings are present on this menu. One or more of the following settings may be present in this menu depending on the selected option.
Delta Type: This input selects which of the following information is displayed in the plot panel.
- Delta (1): Shows values for Delta, Minimum Delta and Maximum Delta corresponding to each price bar. view chart
- Cumulative Delta (2): Shows aggregated delta values for Regular Trading Hours (RTH) and Extended Trading Hours (ETH) sessions. view chart
- Bid/Ask Volume (3): Shows values for trading volume executed at Bid and Ask prices corresponding to each price bar. view chart
- Swing Delta (4): Shows aggregated delta values for each swing (as determined using ZigZag). view chart
- Delta Stochastics (5): Shows the standard Stochastics indicator for Cumulative Delta. view chart
(1), (3) When Delta Type is set to “Delta” or “Bid/Ask Volume”, the following input will be available:
- Value Type: Selects which of the following information is displayed.
- Value: In this mode the raw values for Delta or Bid/Ask Volume are shown.
- Percent of Volume: In this mode the values for Delta or Bid/Ask volume are presented as percentage of total volume.
- Speed: In this mode the rate of Delta or Bid/Ask volume are shown. Speed is measured by dividing the value by the duration of time elapsed in each price bar in seconds.
(2) When Delta Type is set to “Cumulative Delta”, the following input will be available:
- RTH Session Template: Selects the Regular Trading Hours session template which determines RTH session start and end times. Detailed instructions on how to use this input are available here.
(4) When Delta Type is set to “Swing Delta”, the following inputs will be available:
- Rotation Size (Points): Defines the Deviation Value for the ZigZag routine which determines how swings are calculated and when they reverse. This value is in the units of points for the selected instrument.
- Show Swing Delta Values on Price Panel: Enabling this option will display the values of Cumulative Delta per swing on the chart panel. view chart
- Show Current Swing Start Point: Enabling this option will place a marker on the chart that visually identifies the starting time of the most recent swing that is being used to calculate the displayed swing delta. view chart
- Highlight Current Swing: Enabling this option will highlight price bars in the current swing leg to visually identify which price bars are used to calculate the most recent swing delta. view chart
- Swing Delta Text: Customizes the appearance of Swing Delta values on the chart.
- Start Point: Settings in this input group define the visual characteristics of the marker used to show the current swing start point.
- Highlight: Settings in this input group define the visual characteristics of the highlighted region that marks the current swing.
Please review Understanding ZigZag below for a better understanding of how ZigZag operates as it relates to Swing Delta.
(5) When Delta Type is set to “Delta Stochastics”, the following inputs will be available:
- Stochastics Period: Number of price bars used to calculate the Stochastics value for Cumulative Delta.
- Stochastics Smoothing Factor: Smoothing Factor used in Stochastics calculations to reduce noise.
- Upper & Lower Lines: Horizontal thresholds on the 0-100 scale to signal potential extremes.
Delta Highlight:
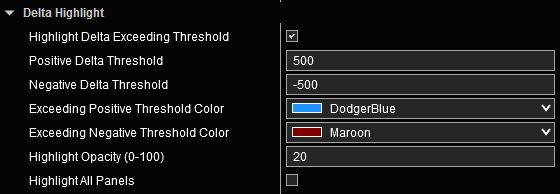
Settings in this section allow highlighting of price bars that have Delta values exceeding predefined positive and negative thresholds to help detect aggressive buying and selling activity. This can be applied to Delta’s raw value, speed or percentage.
To view Highlighting of Delta, enable this section and set threshold values for positive and negative Delta, and customize other settings as preferred.
Plot Appearance:
The Plot Appearance menu in this indicator is an abbreviated version of the standard Plot Appearance menu featured in all our indicators that include plots. Menu items that are not applicable to this indicator have been disabled. The remaining functionality is identical to the standard menu. Detailed explanation of various features and capabilities are available here.
Plots:
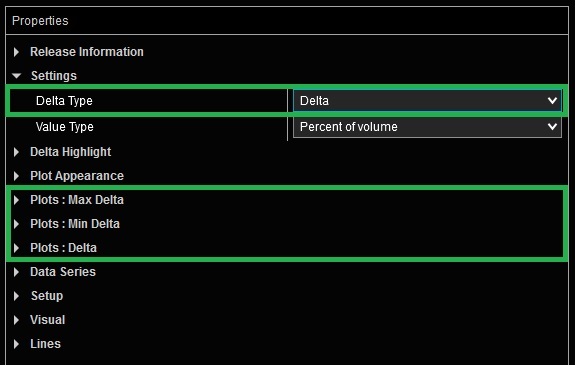
All of our indicators utilize Enhanced Plots Menus that augment the existing functionality provided by standard NinjaTrader Plots menus. The list of Plots that can be customized is context sensitive. Only those Plots that correspond to selected options are shown to reduce the number of inputs, and to streamline the Indicator Properties menu to only include those inputs that are relevant to the selected options. Please refer to Enhanced Plots Menu documentation for additional details.
Understanding ZigZag:
The current developing ZigZag leg will extend as price continues to move in the same direction, or it can reverse if price moves sufficiently in the opposite direction to form a new swing. As one leg is solidified and a new leg is formed, Swing Delta values are recalculated and the chart is redrawn to reflect the new swing points. This may cause the latest Swing Delta value and its anchor point to change. This is normal behavior. The following excerpt is provided to further expand on ZigZag’s behavior.
Note from NinjaTrader ZigZag document:
