Time & Sales Overview
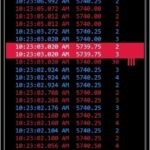
The Time & Sales indicator delivers a real-time, chronological view of every transaction for a specific security, providing deep insights into immediate market activity and the dynamics of supply and demand. It displays key details including execution time, price, volume, and trade direction (e.g., at or above Ask Price, at or below Bid Price). Beyond these core features, our enhanced Time & Sales indicator includes a dashboard that offers a clear snapshot of recent activity across two distinct time frames.
Time & Sales Indicator Highlights:
This indicator is included in our Orderflow Package.
- Quote panel: Displays the current Bid and Ask prices along with the volume available at each price
- Dashboard: Features two separate gauges, each showing the most recent activity for a different time frame
- Standard Time & Sales window: Shows Execution Time, Price, Volume and Direction of Execution
- Ability to individually highlight trades that are executed above ask, at ask, at bid and below bid for clear visual identification
- Daily High/Low indicator to highlight when price reaches new session highs or lows
- Block Trade indicator gauge with up to 5 distinct thresholds
- Filtering based on trade size or order sweeps
- Does not require NinjaTrader’s Lifetime license
- Does not require Tick Replay

