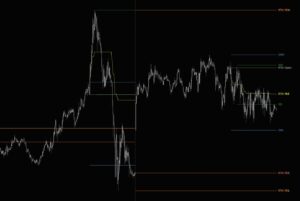
Daily MGI Overview
Market Generated Information (MGI) is a collection of objective data derived from the market’s past behavior. This data is used to analyze market structure and context, identifying significant areas of price action that could potentially serve as Support and Resistance in the near future.
The Daily MGI indicator automates the identification and plotting of these structural market levels that are derived from market activity that took place during current and prior daily sessions.
Daily MGI Indicator Highlights
This indicator is included in our MGI Package.
- Comprehensive list of commonly used daily MGI values including price-based and Orderflow levels such as Value Area and VWAP
- Ability to select between Regular Trading Hours (RTH) and Extended Trading Hours (ETH)
- Range Highlighting and Range Extensions for many values
- RTH and ETH session markers and highlights to visually distinguish session start and end times
- Inline Tooltips on Indicator Properties menu
- Streamlined User Interface that only shows inputs relevant to current selections
- Multiple fully customizable plot styles including regular plots and edge plots
- Enhanced Plots menus allow customization of every aspect of plots including plot names and ability to conveniently turn plots on/off individually
- Highly customizable and easy to use
- Does not require NinjaTrader’s Lifetime license
- Does not require Tick Replay
Information offered by Daily MGI
- Overnight Range view chart
- Overnight Value Area view chart
- Opening Range view chart
- Initial Balance view chart
- Current Day RTH prices view chart
- Current Day ETH prices view chart
- Prior Day RTH prices view chart
- Prior Day ETH prices view chart
- Current Day RTH Value Area view chart
- Current Day ETH Value Area view chart
- Prior Day RTH Value Area view chart
- Prior Day ETH Value Area view chart
- VWAP view chart
- Half Gap view chart

