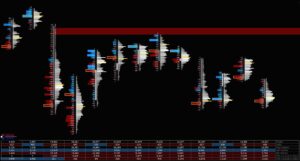
Footprint Chart Overview
Footprint Chart Indicator Highlights
This indicator is included in our Orderflow Package and is also available as a standalone product.
- Supported on many commonly used bar types:
- NinjaTrader builtin bar types: Tick, Volume, Range, Second/Minute, Day, Heiken-Ashi, Renko, Point & Figure
- Third Party bar types: ninZa Renko, Uni Renko
- Ability to choose Volume by Price, Delta by Price or both on the same chart
- Highly customizable Volume and Delta profiles
- Great flexibility in layout, placement, orientation and sizing of Volume and Delta profiles
- Various coloring options: Threshold-based, Value Area, Imbalance, Gradient
- Ability to show Value Area (VAH, VAL, VPOC) with Volume by Price
- Buy/Sell Imbalances
- Stacked Imbalances and Imbalance Zones
- Trapped Traders Zones
- Unfinished Auction
- Threshold based highlighting
- Tick compression with ability to select values for Volume and Delta footprints independently
- Highly customizable Information Table with rows that can be reordered
- Flexible placement of Information Table (top or bottom of chart)
- Comprehensive list of widely used values to display in Information Table
- Ability to hide chart bars
- Streamlined User Interface and intuitive grouping of Indicator Properties
- Does not require NinjaTrader’s Lifetime license
- Does not require Tick Replay

