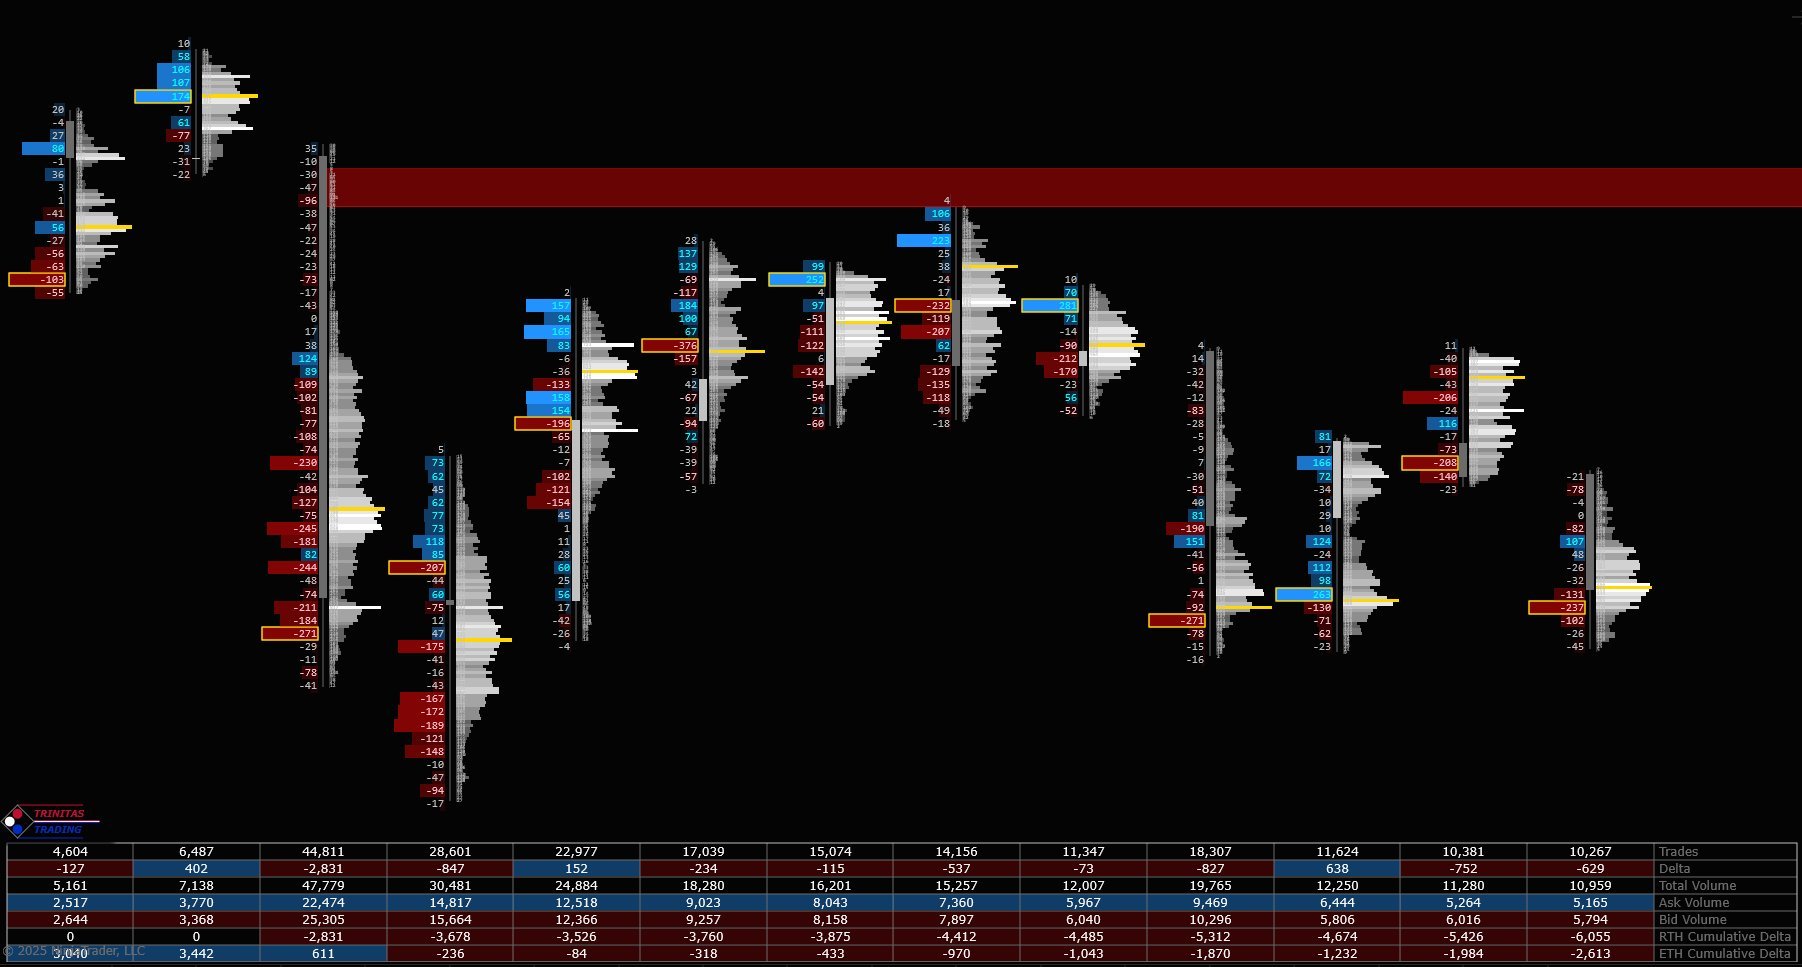
Footprint Chart Overview
A Footprint Chart offers a detailed view of traded volume, aggressive buying/selling (ask/bid volume), and delta at each price level. This deeper insight reveals orderflow data not visible on standard price charts. Plus, the Bar Information Table neatly summarizes key bar data in a concise format.
Footprint Chart Indicator Highlights
This indicator is included in our Orderflow Package and is also available as a standalone product.
- Supported on many commonly used bar types:
- NinjaTrader builtin bar types: Tick, Volume, Range, Second/Minute, Day, Heiken-Ashi, Renko, Point & Figure
- Third Party bar types: ninZa Renko, Uni Renko
- Ability to choose Volume by Price, Delta by Price or both on the same chart
- Highly customizable Volume and Delta profiles
- Great flexibility in layout, placement, orientation and sizing of Volume and Delta profiles
- Various coloring options: Threshold-based, Value Area, Imbalance, Gradient
- Ability to show Value Area (VAH, VAL, VPOC) with Volume by Price
- Buy/Sell Imbalances
- Stacked Imbalances and Imbalance Zones
- Trapped Traders Zones
- Unfinished Auction
- Threshold based highlighting
- Tick compression with ability to select values for Volume and Delta footprints independently
- Highly customizable Information Table with rows that can be reordered
- Flexible placement of Information Table (top or bottom of chart)
- Comprehensive list of widely used values to display in Information Table
- Ability to hide chart bars
- Streamlined User Interface and intuitive grouping of Indicator Properties
- Does not require NinjaTrader’s Lifetime license
- Does not require Tick Replay