
Time & Sales User Guide
The Time & Sales indicator delivers a real-time, chronological view of every transaction for a specific security, providing deep insights into immediate market activity and the dynamics of supply and demand. It displays key details including execution time, price, volume, and trade direction (e.g., at or above Ask Price, at or below Bid Price). Beyond these core features, our enhanced Time & Sales indicator includes a dashboard that offers a clear snapshot of recent activity across two distinct time frames.

Time & Sales Indicator Highlights:
This indicator is included in our Orderflow Package.
- Quote panel: Displays the current Bid and Ask prices along with the volume available at each price
- Dashboard: Features two separate gauges, each showing the most recent activity for a different time frame
- Standard Time & Sales window: Shows Execution Time, Price, Volume and Direction of Execution
- Ability to individually highlight trades that are executed above ask, at ask, at bid and below bid for clear visual identification
- Daily High/Low indicator to highlight when price reaches new session highs or lows
- Block Trade indicator gauge with up to 5 distinct thresholds
- Filtering based on trade size or order sweeps
- Does not require NinjaTrader’s Lifetime license
- Does not require Tick Replay
Adding and Removing Indicators
To add or remove indicators on your charts, consult NinjaTrader’s ‘Working with Indicators’ documentation for step-by-step guidance.
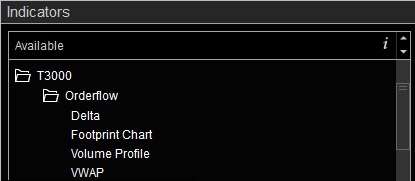
After installing the Orderflow package, you will find this indicator in the T3000/Orderflow folder within NinjaTrader’s Indicators menu.
User Guide
Understanding the layout of the Time & Sales display:
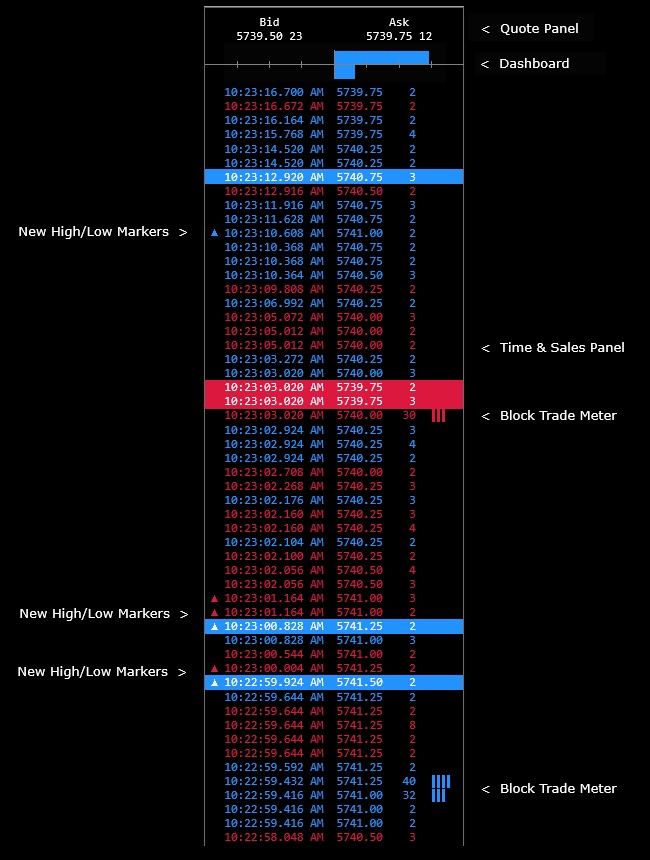
The following list of options and menus are available in this indicator and will be discussed in detail in the following sections.
Tooltips: Various Tooltips are present throughout Indicator Properties menu that offer additional information about certain inputs and options available on the menu. Tooltips start with (?) and will display additional information related to the particular menu item when the corresponding checkbox is selected.
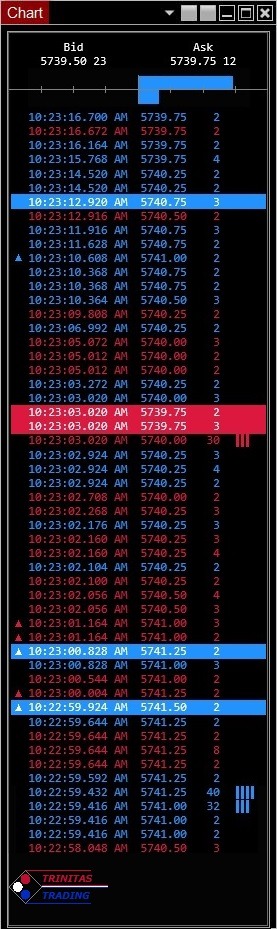
Quotes:
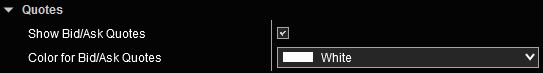
Settings in this section activate the Quotes Panel at the top of the Time & Sales display and allow for its customization.
The information shown in this panel includes:
- Bid / Bid Volume: The current Bid price and number of contracts available at this price.
- Ask / Ask Volume: The current Ask price and number of contracts available at this price.
Dashboard:
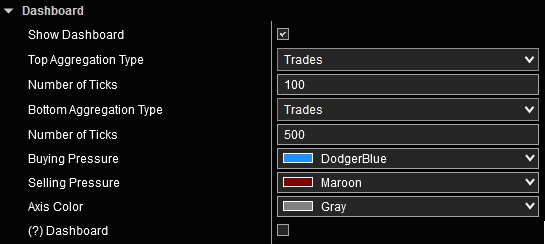
Settings in this section enable the activity Dashboard in the Time & Sales display and allow for its customization.
Time & Sales:
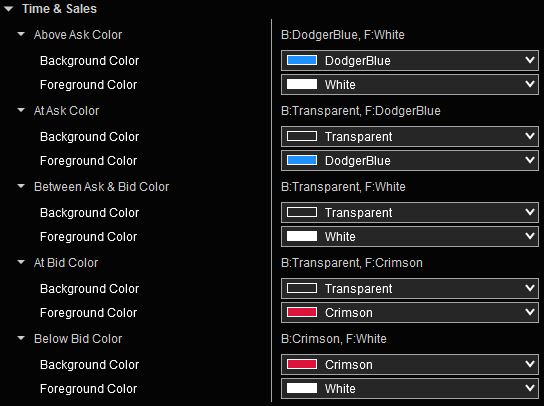
- Above Ask: Trade was executed at a price that was higher than current Ask Price
- At Ask: Trade was executed at current Ask Price
- Between Ask & Bid: Trade was executed between current Bid and Ask prices
- At Bid: Trade was executed at current Bid Price
- Below Bid: Trade was executed at a price that was lower than current Bid Price
Table Settings:
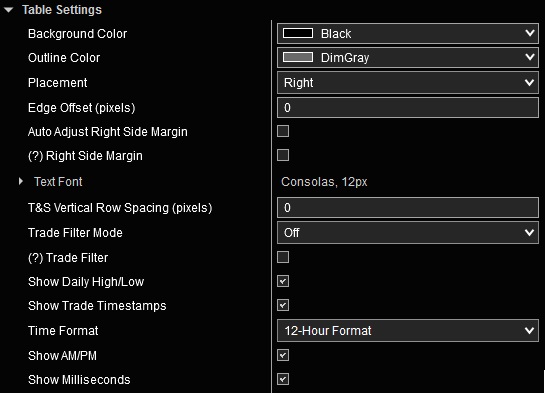
The settings in this section enable customization of the Time & Sales panel’s appearance, including the format and type of data displayed.
- Background Color: Selects the color of Time & Sales panel’s background.
- Outline Color: Selects the color of Time & Sales panel’s outline. Set to Transparent for no outline.
- Placement: Determines whether the Time & Sales window is placed at the Right or Left edge of the chart panel.
- Edge Offset: Adjusts the distance between the Time & Sales window edge and chart panel edge in pixels.
- Auto Adjust Right Side Margin: With this option activated, the chart’s right margin will be automatically adjusted to prevent price bars from entering into indicator’s drawings. With this option disabled, the right margin can manually be adjusted as required from the Chart Properties menu. This option is only present if Placement is set to Right.
- IMPORTANT: When using several indicators on a single chart that provide this feature, ensure that only one indicator has this option activated. Activating this option on multiple indicators within the same chart could lead to simultaneous adjustments of the right margin, potentially causing erratic behavior.
- Additional Right Side Margin (pixels): If “Auto Adjust Right Side Margin” is active and additional space is needed on the right margin, this setting allows the margin to be expanded as needed.
- Text Font: Selects the font used for all information being displayed within all panels.
- T&S Vertical Row Spacing (pixels): Adds additional space between rows in the Time & Sales panel.
- Trade Filter Mode: Defines the criteria for trades that are displayed in the Time & Sales panel.
- Off: All trades are shown
- Size: Only trades with volume exceeding the specified threshold are shown
- Sweep: Only trades that are executed above Ask or below Bid are shown indicating aggressive buying or selling activity
- Show Daily High/Low: Enabling this option displays up or down arrows on the left of the Time & Sales panel when a new daily High or Low price is reached.
- Show Trade Timestamps: Enabling this option displays the timestamp of each trade shown on the Time & Sales panel.
- Time Format, Show AM/PM and Show Milliseconds options customize the format of the trade timestamp.
Block Trades:
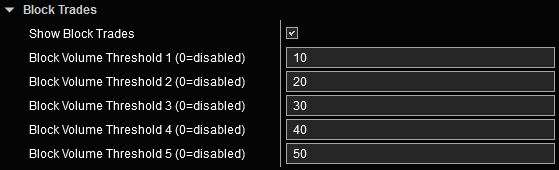
When Block Trades are enabled, a series of 1 to 5 vertical bars appear on the right side of each row where trade volume exceeds any of up to five configurable threshold values.
Tip: How to display Time & Sales on a standalone window with nothing else
The Time & Sales window typically appears on either the right or left edge of a chart. To make it a standalone window, follow these instructions:
- Open a new chart (New > Chart) and configure Data Series. Any Minute based data series with 1 day to load should be sufficient.
- Remove all other indicators from the chart.
- Only add the Time & Sales indicator.
- In Data Series properties:
- change “Chart style” to “Line on Close” and set color to Transparent.
- set “Price marker” to not be visible.
- set “Scale justification” to “Overlay”.
- In Chart Properties
- set all grid lines and any other colors to Transparent.
- set “Right side margin” to 0.
- uncheck Show Scrollbar.
- In Indicator Properties: set “Scale justification” to “Overlay”.
- Resize the chart window to only include the Time & Sales window.