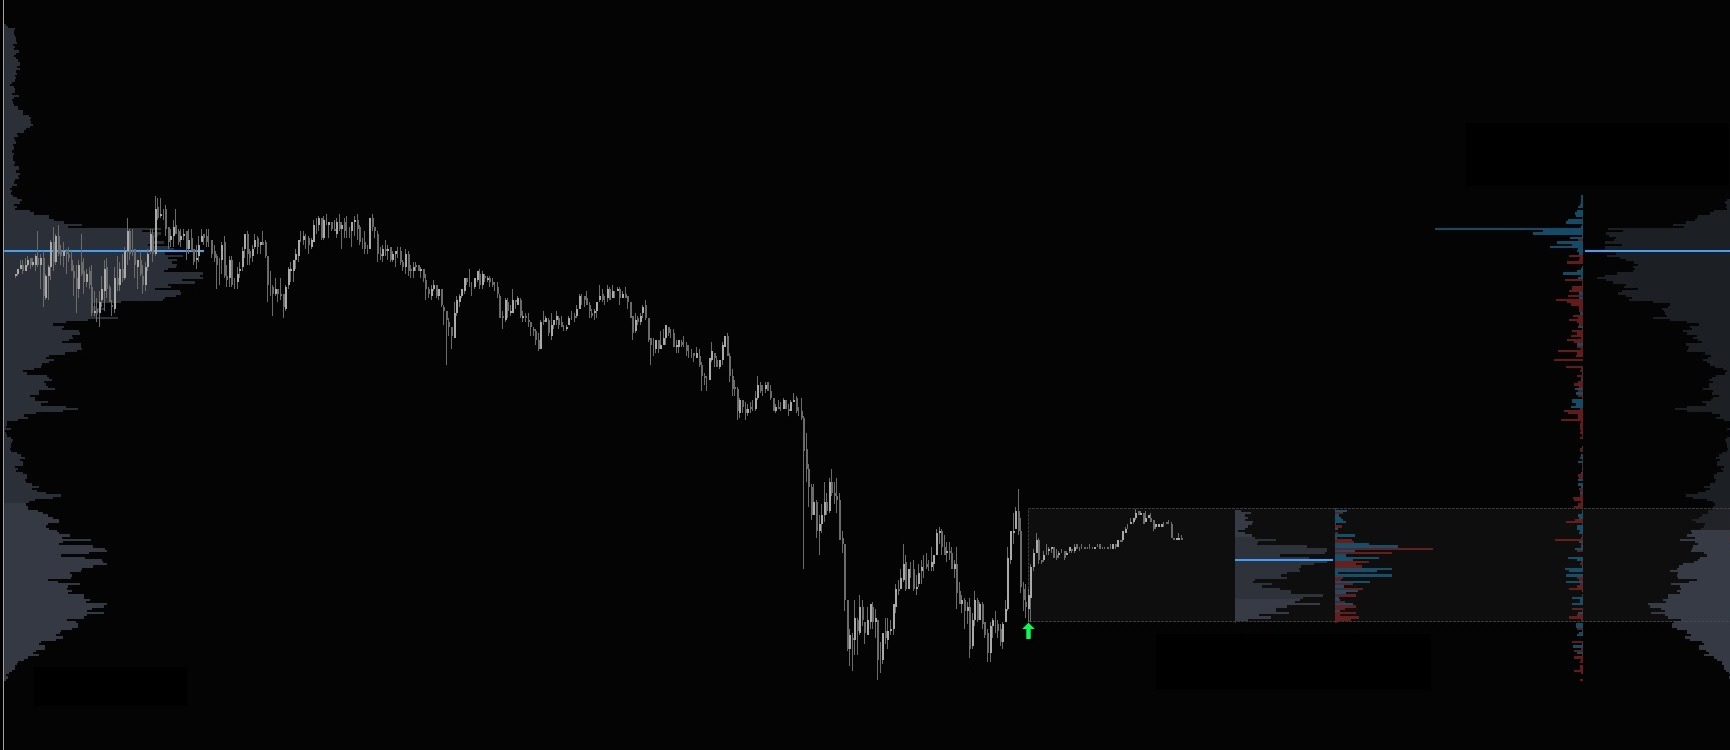
Volume Profile Overview
The Volume Profile is a dynamic horizontal histogram that delivers a detailed snapshot of key trading data. It includes traded volume, bid and ask volume, delta (the difference between ask and bid volume), or a blend of these metrics, all aggregated over a specific timeframe. This powerful visualization uncovers critical insights, empowering traders to pinpoint high-liquidity zones based on volume distribution, essential for identifying potential support and resistance levels.
Volume Profile Indicator Highlights
This indicator is included in our Orderflow Package and is also available as a standalone product.
- Many pre-configured or user-specified timeframes:
- Current Swing Leg (Leg to leg profile)
- Current RTH or ETH sessions
- Current Week or Month
- Since a specified time
- During a specified time span
- Rolling number of Minutes, Days or Weeks
- Entire chart
- Chart visible range
- Custom range using visual selection tool
- Volume by Price, Delta by Price or both on the same chart
- Value Area, Threshold based filtering, Gradient coloring
- Automated HVN & LVN drawings
- Highly customizable Volume by Price and Delta by Price profiles
- Great flexibility in layout, placement, orientation and sizing of Volume and Delta profiles
- Ability to show Value Area (VAH, VAL, VPOC) with Volume by Price
- Tick compression with ability to select values for Volume and Delta profiles independently
- Ability to hide chart bars
- Streamlined User Interface and intuitive grouping of Indicator Properties
- Does not require NinjaTrader’s Lifetime license
- Does not require Tick Replay