Weekly MGI User Guide
Market Generated Information (MGI) is a collection of objective data derived from the market’s past behavior. This data is used to analyze market structure and context, identifying significant areas of price action that could potentially serve as Support and Resistance in the near future.
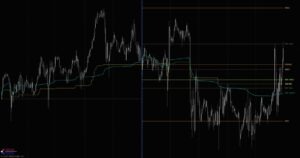
The Weekly MGI indicator automates the identification and plotting of these structural market levels that are derived from market activity that took place during current and prior weeks.
Weekly MGI Indicator Highlights
This indicator is included in our MGI Package.
- Comprehensive list of commonly used weekly MGI values including price-based and Orderflow levels such as Value Area and VWAP
- Range Highlighting and Range Extensions for many values
- Inline Tooltips on Indicator Properties menu
- Streamlined User Interface that only shows inputs relevant to current selections
- Multiple fully customizable plot styles including regular plots and edge plots
- Enhanced Plots menus allow customization of every aspect of plots including plot names and ability to conveniently turn plots on/off individually
- Highly customizable and easy to use
- Does not require NinjaTrader’s Lifetime license
- Does not require Tick Replay
Adding and Removing Indicators
To add or remove indicators on your charts, consult NinjaTrader’s ‘Working with Indicators’ documentation for step-by-step guidance.
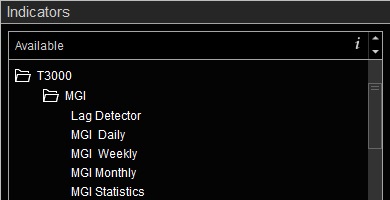
After installing the MGI package, you will find this indicator in the T3000/MGI folder within NinjaTrader’s Indicators menu.
Weekly MGI User Guide
The following list of options and menus are available in this indicator and will be discussed in detail in the following sections. Please note that this user guide covers all features available in our Premium MGI package. The Free MGI package may not include certain features that are discussed below. Features that are not available in the Free MGI package will be clearly marked in Indicator Properties on the free version.
Plot Groups to Show:
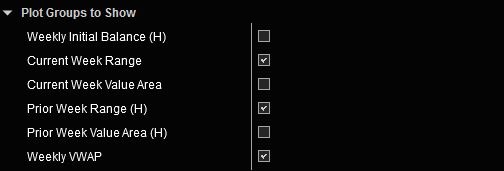
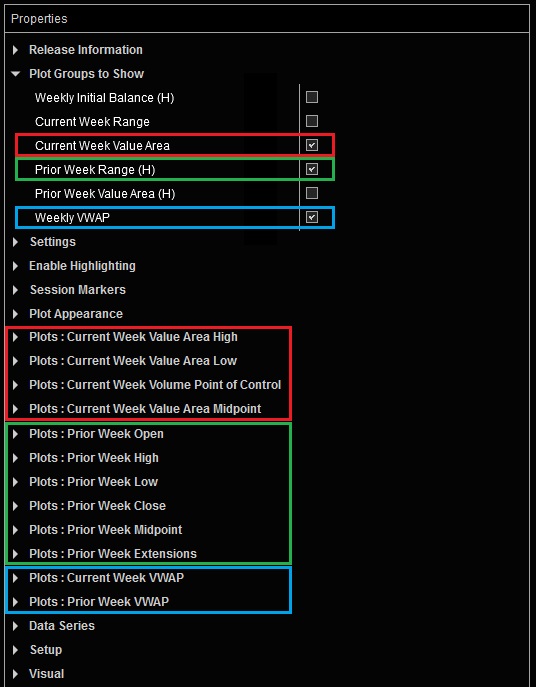
This indicator provides multiple Groups of MGI values. Each group is enabled individually and may include multiple Plots for various levels and measurements. Selecting any of the checkboxes in the Plot Groups to Show section will enable a group of corresponding plots further below in the Plots section of the Indicator Properties menu.
Available plot groups and individual plots included in each group are shown below:
- Weekly Initial Balance view chart
- Weekly Initial Balance High (WIBH)
- Weekly Initial Balance Low (WIBL)
- Weekly Initial Balance Midpoint (WIBMid)
- Up to 4 sets of Range Extensions
- Current Week Range view chart
- Current Week Open (WKO)
- Current Week High (WKH)
- Current Week Low (WKL)
- Current Week Midpoint (WKMid)
- Current Week Value Area view chart
- Current Week Value Area High (WK VAH)
- Current Week Value Area Low (WK VAL)
- Current Week Volume Point of Control (WK VPOC)
- Current Week Value Area Midpoint (WK VAMid)
- Prior Week Range view chart
- Prior Week Open (PWO)
- Prior Week High (PWH)
- Prior Week Low (PWL)
- Prior Week Close (PWC)
- Prior Week Midpoint (PWMid)
- Up to 4 sets of Range Extensions
- Prior Week Value Area view chart
- Prior Week Value Area High (PW VAH)
- Prior Week Value Area Low (PW VAL)
- Prior Week Volume Point of Control (PW VPOC)
- Prior Week Value Area Midpoint (PW VAMid)
- Up to 4 sets of Range Extensions
- Weekly Volume Weighted Average Price (VWAP) view chart
- Current Week Developing VWAP (WK VWAP)
- Prior Week Closing VWAP (PW VWAP)
Settings:
The Settings menu is context sensitive. It will only include inputs that correspond to selected options. One or more of the following inputs may be present in this menu depending on the options you have selected.
Weekly IB Duration (HH:MM): Selects the length of time used to calculate the Weekly Initial Balance as measured from the Sunday Globex session start time. By default this value is set to 30 hours. This input is only available if Weekly Initial Balance is enabled in Plot Groups to Show section. Weekly IB plots will start printing after the designated time has elapsed and the range has finalized.
Calculation Resolution (Accuracy vs Speed): This setting offers a trade-off between computational accuracy versus speed in Value Area and VWAP calculations. More accurate settings will require more time and will be slower. The following general guidelines can help you determine which mode is best in which scenario.
- Accurate: This mode, which uses 1-tick resolution, is the most accurate mode for calculations. It is most appropriate on charts with no more than 2-3 weeks of data loaded, and when extreme accuracy is required.
- Balanced: This mode uses 1-second bars for calculations. Computation speed is faster than Accurate mode and results can vary depending on data. In most cases, this mode will generate results that are fairly close to Accurate mode but at a fraction of the time. This mode is best used on charts with up to 3-6 weeks of data (see Note below).
- Fast: This mode uses 10-second bars to perform calculations. Computation speed is faster than Balanced mode. There may be variations in results based on the underlying data. This mode is appropriate for charts with 4-8 weeks of data (see Note below).
- Fastest: This mode uses 1-minute bars for calculations. The most appropriate use for this mode is for Weekly or Monthly charts with more than 2 months of data loaded.
Data Download Guidelines for Tick Data:
- NinjaTrader uses Tick data to construct 1-second and 10-second bars that are used in calculations. If your Data Provider limits the total number of days of Historical Tick Data they provide, you may not be able to use Accurate, Balanced and Fast modes.
- If you have more days loaded on your chart than days of Historical Tick Data provided by your Data Provider, the indicator could hang and may not be able to display results in Accurate, Balanced and Fast modes. In that case, you can only use the Fastest mode which uses 1-minute bars for calculations.
- Most data providers restrict the number of days of tick data available for download during Regular Trading Hours (RTH) to a limited range, typically 5-7 days. If you need more days of data for this indicator, we recommend performing the initial download outside of RTH (e.g., after market close). This first download should retrieve the required data and store it locally on your system. For all subsequent uses of the indicator, only new incremental data will be downloaded, avoiding the provider’s daily limit.
- Each Data Provider has different limits which they may update over time. Please check with your Data Provider to understand these limitations as they relate to your use case.
- The Value Area calculation can vary widely when using Calculation Resolutions other than Accurate. This variance depends on trade data, ie; the volume transacted at different price levels. In some cases, results may closely align with Accurate mode, while in others, they may differ noticeably. For maximum precision, please use the Accurate mode.
- The VWAP calculation is less sensitive to data variations and typically delivers highly accurate results for longer term VWAPs, even with faster Calculation Resolution settings.
Value Area (%): Percentage of trading volume used for Value Area Calculations. This input is only available if any of the Value Area options are enabled in Plot Groups to Show section.
Value Area Calculation Tick Compression: This parameter determines the number of price levels that are combined together prior to Value Area calculations. This input is only available if any of the Value Area options are enabled in Plot Groups to Show section.
With Tick Compression of 2, sum of volumes from the next two price levels above the POC are compared to sum of volumes from the next two price levels below the POC. This process is repeated until the desired percentage of volume is reached. With Tick Compression of 1, volume from each price level is considered separately which allows for a more granular Value Area calculation. The traditional method for calculating Value Area uses Tick Compression of 2 price levels.
Enable Highlighting:
The Enable Highlighting menu is context sensitive. It will only include inputs that correspond to plot groups that have been enabled in the Plot Groups to Show section. Plot Groups that include this option are labeled with (H) in the Plot Groups to Show menu. The exact number of input groups in this menu will depend on the number of enabled Plot Groups that support highlighted regions.
Session Markers:
This setting places a vertical line at the start of a new trading week. This is generally the start time of the Sunday Globex session.
Plot Appearance:
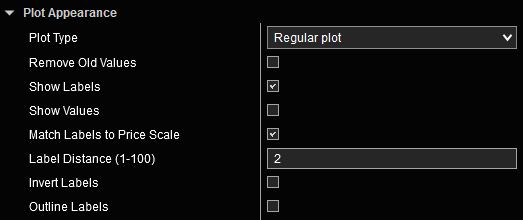
The Plot Appearance menu is a standard feature in all our indicators that include plots. Detailed explanation of various features and capabilities are available here.
Plots:
All of our indicators utilize Enhanced Plots Menus that augment the existing functionality provided by standard NinjaTrader Plots menus. The list of Plots that can be customized is context sensitive. Only those Plots that correspond to Plot Groups that have been enabled in the Plot Groups to Show section are shown to reduce the number of inputs, and to streamline the Indicator Properties menu to only include those inputs that are relevant to the selected options. Please refer to Enhanced Plots Menu documentation for additional details.
