
MGI Statistics Overview
Market Generated Information (MGI) is a collection of objective data derived from the market’s past behavior. This data is used to analyze market structure and context, identifying significant areas of price action that could potentially serve as Support and Resistance in the near future.
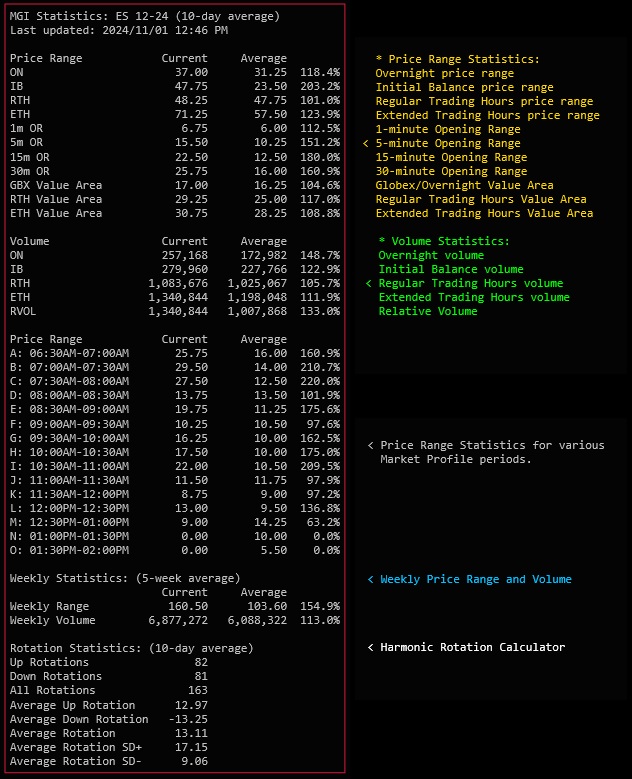
The MGI Statistics indicator provides various statistics and averages to help characterize market’s recent behavior in an effort to gain awareness of recent tendencies and context to help guide trading decisions. To avoid skewing results, any holidays and short trading sessions are excluded from consideration during calculations.
MGI Statistics Indicator Highlights
This indicator is included in our MGI Package.
- Comprehensive list of commonly used market statistics and averages
- Price-based and Orderflow-based averages
- Price range and trading volume averages
- Daily and weekly averages
- Harmonic Rotation calculator
- Inline Tooltips on Indicator Properties menu
- Highly customizable and easy to use
Averages and Statistics offered by MGI Statistics
- Daily Ranges:
- Overnight Range
- Initial Balance Range
- RTH and ETH Range
- 1,5,15,30 minute Opening Range
- Trade Periods (30 minute intervals during RTH)
- Value Area
- Overnight Session
- RTH and ETH Sessions
- Volume Averages
- Overnight Volume
- Initial Balance Volume
- RTH and ETH Volume
- Relative Volume
- Weekly Averages:
- Weekly Range
- Weekly Volume
- Rotation Calculator